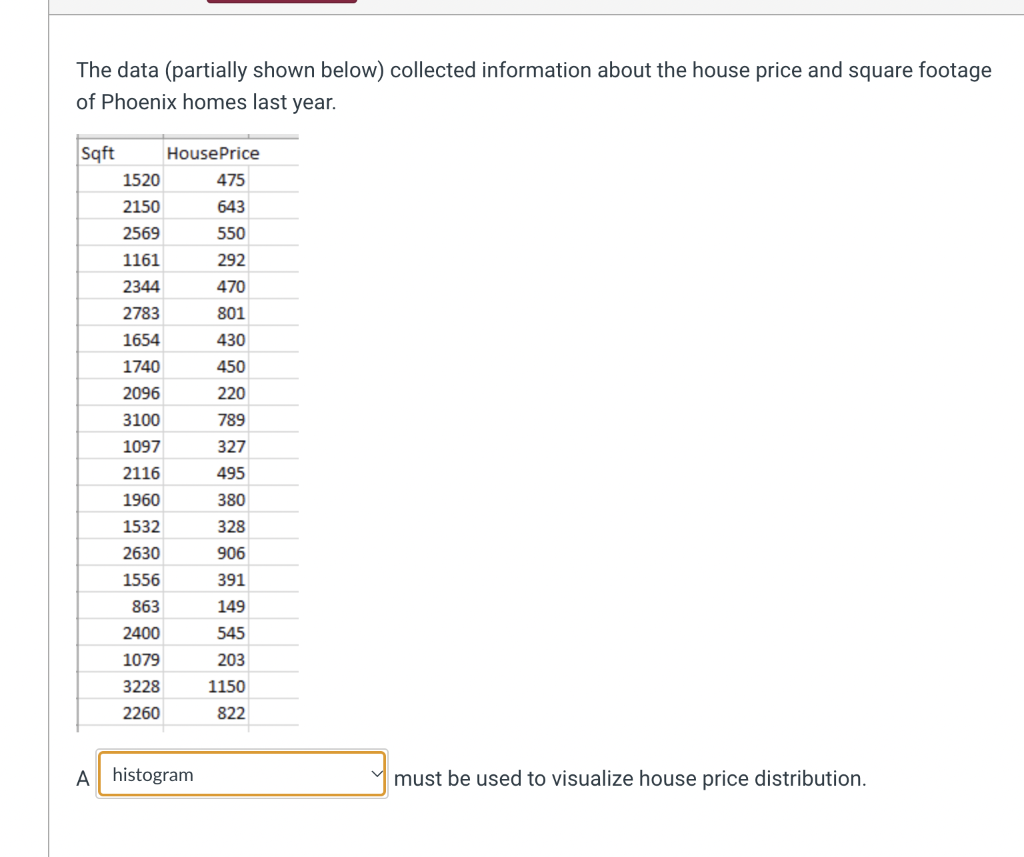
The data (partially shown below) collected information about the house price and square foota of Phoenix homes last year. Sqft 1520 2150 2569 1161 2344 2783 1654 1740 2096 3100 1097 2116 1960 1532 2630 1556 863 2400 1079 3228 2260 HousePrice 475 643 550 292 470 801 430 450 220 789 327 495 380 328 906 391 149 545 203 1150 822 A histogram must be used to visualize house price distribution.
The data (partially shown below) collected information about the house price and square foota of Phoenix homes last year. Sqft 1520 2150 2569 1161 2344 2783 1654 1740 2096 3100 1097 2116 1960 1532 2630 1556 863 2400 1079 3228 2260 HousePrice 475 643 550 292 470 801 430 450 220 789 327 495 380 328 906 391 149 545 203 1150 822 A histogram must be used to visualize house price distribution.

Glencoe Algebra 1, Student Edition, 9780079039897, 0079039898, 2018
18th Edition
ISBN:9780079039897
Author:Carter
Publisher:Carter
Chapter10: Statistics
Section10.5: Comparing Sets Of Data
Problem 14PPS

Related questions
Question
100%
I want know how to solve this.
Help me
Transcribed Image Text:The data (partially shown below) collected information about the house price and square footage
of Phoenix homes last year.
Sqft
A
1520
2150
2569
1161
2344
2783
1654
1740
2096
3100
1097
2116
1960
1532
2630
1556
863
2400
1079
3228
2260
House Price
475
643
550
292
470
801
430
450
220
789
327
495
histogram
380
328
906
391
149
545
203
1150
822
must be used to visualize house price distribution.
Expert Solution
This question has been solved!
Explore an expertly crafted, step-by-step solution for a thorough understanding of key concepts.

This is a popular solution!

Trending now
This is a popular solution!

Step by step
Solved in 3 steps with 1 images

Recommended textbooks for you
Glencoe Algebra 1, Student Edition, 9780079039897…
Algebra
ISBN:
9780079039897
Author:
Carter
Publisher:
McGraw Hill

Functions and Change: A Modeling Approach to Coll…
Algebra
ISBN:
9781337111348
Author:
Bruce Crauder, Benny Evans, Alan Noell
Publisher:
Cengage Learning
Glencoe Algebra 1, Student Edition, 9780079039897…
Algebra
ISBN:
9780079039897
Author:
Carter
Publisher:
McGraw Hill
Functions and Change: A Modeling Approach to Coll…
Algebra
ISBN:
9781337111348
Author:
Bruce Crauder, Benny Evans, Alan Noell
Publisher:
Cengage Learning