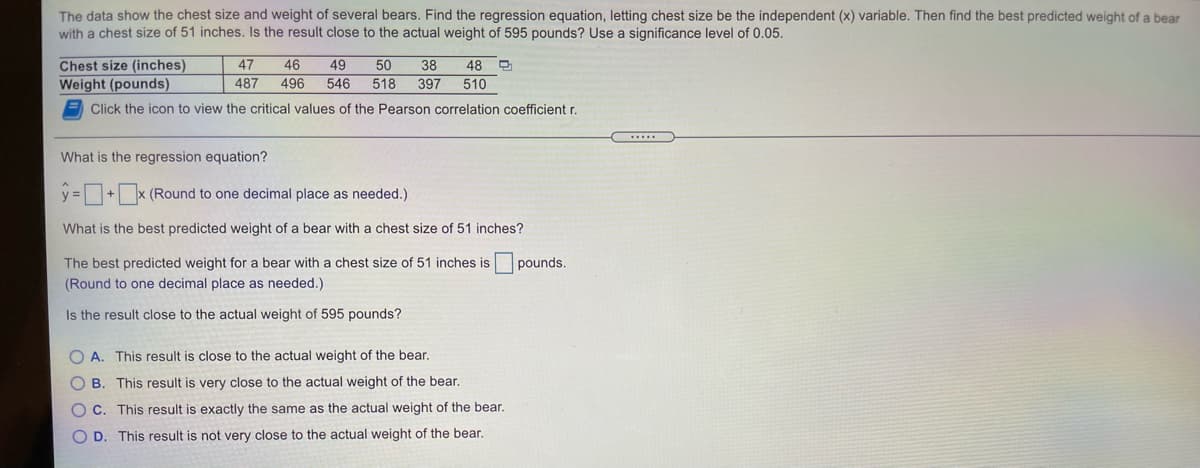
The data show the chest size and weight of several bears. Find the regression equation, letting chest size be the independent (x) variable. Then find the best predicted weight of a bear with a chest size of 51 inches. Is the result close to the actual weight of 595 pounds? Use a significance level of 0.05. 48 O Chest size (inches) Weight (pounds) 50 518 397 47 46 49 38 487 496 546 510 Click the icon to view the critical values of the Pearson correlation coefficient r. What is the regression equation? =+x (Round to one decimal place as needed.) y : What is the best predicted weight of a bear with a chest size of 51 inches? The best predicted weight for a bear with a chest size of 51 inches is pounds. (Round to one decimal place as needed.) Is the result close to the actual weight of 595 pounds? O A. This result is close to the actual weight of the bear. O B. This result is very close to the actual weight of the bear. O C. This result is exactly the same as the actual weight of the bear. O D. This result is not very close to the actual weight of the bear.
The data show the chest size and weight of several bears. Find the regression equation, letting chest size be the independent (x) variable. Then find the best predicted weight of a bear with a chest size of 51 inches. Is the result close to the actual weight of 595 pounds? Use a significance level of 0.05. 48 O Chest size (inches) Weight (pounds) 50 518 397 47 46 49 38 487 496 546 510 Click the icon to view the critical values of the Pearson correlation coefficient r. What is the regression equation? =+x (Round to one decimal place as needed.) y : What is the best predicted weight of a bear with a chest size of 51 inches? The best predicted weight for a bear with a chest size of 51 inches is pounds. (Round to one decimal place as needed.) Is the result close to the actual weight of 595 pounds? O A. This result is close to the actual weight of the bear. O B. This result is very close to the actual weight of the bear. O C. This result is exactly the same as the actual weight of the bear. O D. This result is not very close to the actual weight of the bear.

Functions and Change: A Modeling Approach to College Algebra (MindTap Course List)
6th Edition
ISBN:9781337111348
Author:Bruce Crauder, Benny Evans, Alan Noell
Publisher:Bruce Crauder, Benny Evans, Alan Noell
Chapter3: Straight Lines And Linear Functions
Section3.CR: Chapter Review Exercises
Problem 15CR: Life Expectancy The following table shows the average life expectancy, in years, of a child born in...

Related questions
Question
Transcribed Image Text:The data show the chest size and weight of several bears. Find the regression equation, letting chest size be the independent (x) variable. Then find the best predicted weight of a bear
with a chest size of 51 inches. Is the result close to the actual weight of 595 pounds? Use a significance level of 0.05.
48 O
Chest size (inches)
Weight (pounds)
50
518 397
47
46
49
38
487
496
546
510
Click the icon to view the critical values of the Pearson correlation coefficient r.
What is the regression equation?
=+x (Round to one decimal place as needed.)
What is the best predicted weight of a bear with a chest size of 51 inches?
The best predicted weight for a bear with a chest size of 51 inches is
pounds.
(Round to one decimal place as needed.)
Is the result close to the actual weight of 595 pounds?
O A. This result is close to the actual weight of the bear.
O B. This result is very close to the actual weight of the bear.
O C. This result is exactly the same as the actual weight of the bear.
O D. This result is not very close to the actual weight of the bear.
Transcribed Image Text:.....
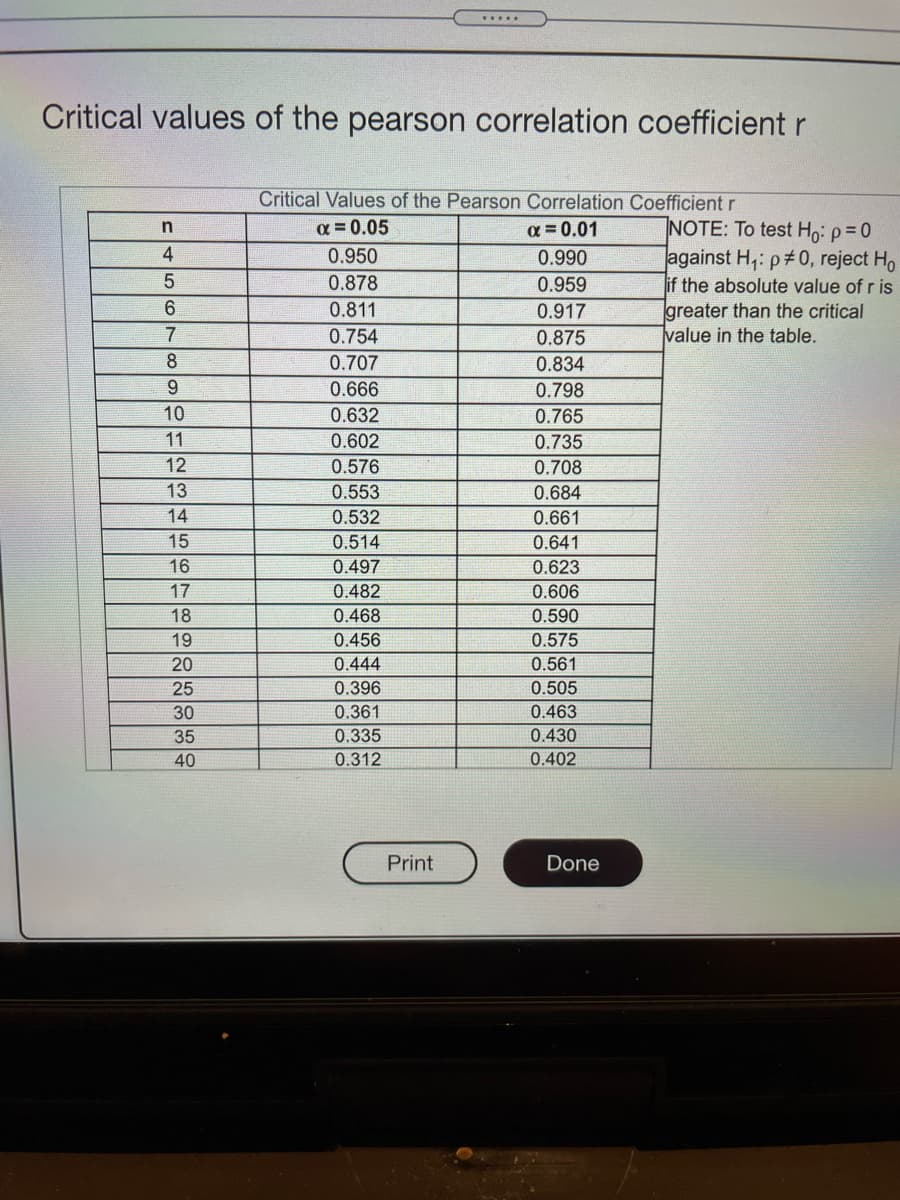
Critical values of the pearson correlation coefficient r
Critical Values of the Pearson Correlation Coefficient r
NOTE: To test Ho: p= 0
against H,: p#0, reject Ho
if the absolute value of r is
greater than the critical
value in the table.
a = 0.05
a = 0.01
4
0.950
0.990
0.878
0.959
6.
0.811
0.917
7
0.754
0.875
8
0.707
0.834
9.
0.666
0.798
10
0.632
0.765
11
0.602
0.735
12
0.576
0.708
13
0.553
0.684
14
0.532
0.661
15
0.514
0.641
16
0.497
0.623
17
0.482
0.606
18
0.468
0.590
19
0.456
0.575
20
0.444
0.561
25
0.396
0.505
30
0.361
0.463
35
0.335
0.430
40
0.312
0.402
Print
Done
Expert Solution
This question has been solved!
Explore an expertly crafted, step-by-step solution for a thorough understanding of key concepts.

This is a popular solution!

Trending now
This is a popular solution!

Step by step
Solved in 2 steps with 2 images

Recommended textbooks for you
Functions and Change: A Modeling Approach to Coll…
Algebra
ISBN:
9781337111348
Author:
Bruce Crauder, Benny Evans, Alan Noell
Publisher:
Cengage Learning

Glencoe Algebra 1, Student Edition, 9780079039897…
Algebra
ISBN:
9780079039897
Author:
Carter
Publisher:
McGraw Hill

College Algebra
Algebra
ISBN:
9781305115545
Author:
James Stewart, Lothar Redlin, Saleem Watson
Publisher:
Cengage Learning
Functions and Change: A Modeling Approach to Coll…
Algebra
ISBN:
9781337111348
Author:
Bruce Crauder, Benny Evans, Alan Noell
Publisher:
Cengage Learning
Glencoe Algebra 1, Student Edition, 9780079039897…
Algebra
ISBN:
9780079039897
Author:
Carter
Publisher:
McGraw Hill
College Algebra
Algebra
ISBN:
9781305115545
Author:
James Stewart, Lothar Redlin, Saleem Watson
Publisher:
Cengage Learning

Algebra & Trigonometry with Analytic Geometry
Algebra
ISBN:
9781133382119
Author:
Swokowski
Publisher:
Cengage
