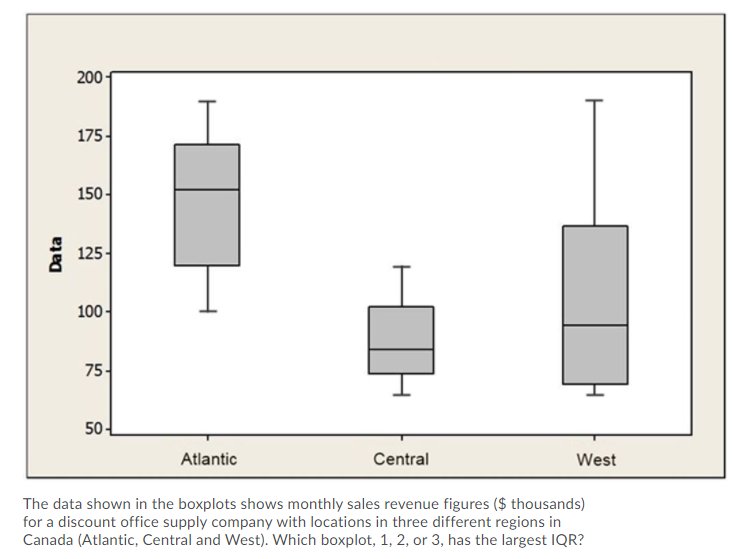
The data shown in the boxplots shows monthly sales revenue figures ($ thousands) for a discount office supply company with locations in three different regions in Canada (Atlantic, Central and West). Which boxplot, 1, 2, or 3, has the largest IQR?
The data shown in the boxplots shows monthly sales revenue figures ($ thousands) for a discount office supply company with locations in three different regions in Canada (Atlantic, Central and West). Which boxplot, 1, 2, or 3, has the largest IQR?

Elementary Linear Algebra (MindTap Course List)
8th Edition
ISBN:9781305658004
Author:Ron Larson
Publisher:Ron Larson
Chapter2: Matrices
Section2.5: Markov Chain
Problem 45E: Epidemic Model In a population of 200,000 people, 40,000 are infected with a virus. After a person...

Related questions
Question
Struggling with data: quick note - 1 for Atlantic, 2 for Central and 3 for West
Transcribed Image Text:200-
175-
150어
125
100어
75
50-
Atlantic
Central
West
The data shown in the boxplots shows monthly sales revenue figures ($ thousands)
for a discount office supply company with locations in three different regions in
Canada (Atlantic, Central and West). Which boxplot, 1, 2, or 3, has the largest IQR?
Data
Expert Solution
This question has been solved!
Explore an expertly crafted, step-by-step solution for a thorough understanding of key concepts.

This is a popular solution!

Trending now
This is a popular solution!

Step by step
Solved in 2 steps

Recommended textbooks for you
Elementary Linear Algebra (MindTap Course List)
Algebra
ISBN:
9781305658004
Author:
Ron Larson
Publisher:
Cengage Learning

College Algebra
Algebra
ISBN:
9781305115545
Author:
James Stewart, Lothar Redlin, Saleem Watson
Publisher:
Cengage Learning

Algebra and Trigonometry (MindTap Course List)
Algebra
ISBN:
9781305071742
Author:
James Stewart, Lothar Redlin, Saleem Watson
Publisher:
Cengage Learning
Elementary Linear Algebra (MindTap Course List)
Algebra
ISBN:
9781305658004
Author:
Ron Larson
Publisher:
Cengage Learning
College Algebra
Algebra
ISBN:
9781305115545
Author:
James Stewart, Lothar Redlin, Saleem Watson
Publisher:
Cengage Learning
Algebra and Trigonometry (MindTap Course List)
Algebra
ISBN:
9781305071742
Author:
James Stewart, Lothar Redlin, Saleem Watson
Publisher:
Cengage Learning