The data to the right represent the cost of living for 20 states. The cost of living is a measure of the average price paid for housing, utilities, groceries, healthcare, transportation, and miscellaneous expenses. The national average cost of living is 100. The data can be used to compare a state to the national average and to other states. 153.2120.5100.2 92.3 91.7 137.2120.2 95.2 92.2 91.4 132.9106.6 94.6 91.9 90.8 126.3100.7 94.3 91.8 90.8 ..... Use these data to construct a frequency distribution with a first class of 85.0- 94.9. Fill in the missing classes and the frequency for each class below. Cost of living Number of states 85.0-94.9 125.0- 134.9 8:8 20 (Type integers or decimals. Do not round.)
The data to the right represent the cost of living for 20 states. The cost of living is a measure of the average price paid for housing, utilities, groceries, healthcare, transportation, and miscellaneous expenses. The national average cost of living is 100. The data can be used to compare a state to the national average and to other states. 153.2120.5100.2 92.3 91.7 137.2120.2 95.2 92.2 91.4 132.9106.6 94.6 91.9 90.8 126.3100.7 94.3 91.8 90.8 ..... Use these data to construct a frequency distribution with a first class of 85.0- 94.9. Fill in the missing classes and the frequency for each class below. Cost of living Number of states 85.0-94.9 125.0- 134.9 8:8 20 (Type integers or decimals. Do not round.)

Glencoe Algebra 1, Student Edition, 9780079039897, 0079039898, 2018
18th Edition
ISBN:9780079039897
Author:Carter
Publisher:Carter
Chapter10: Statistics
Section10.5: Comparing Sets Of Data
Problem 26PFA

Related questions
Question
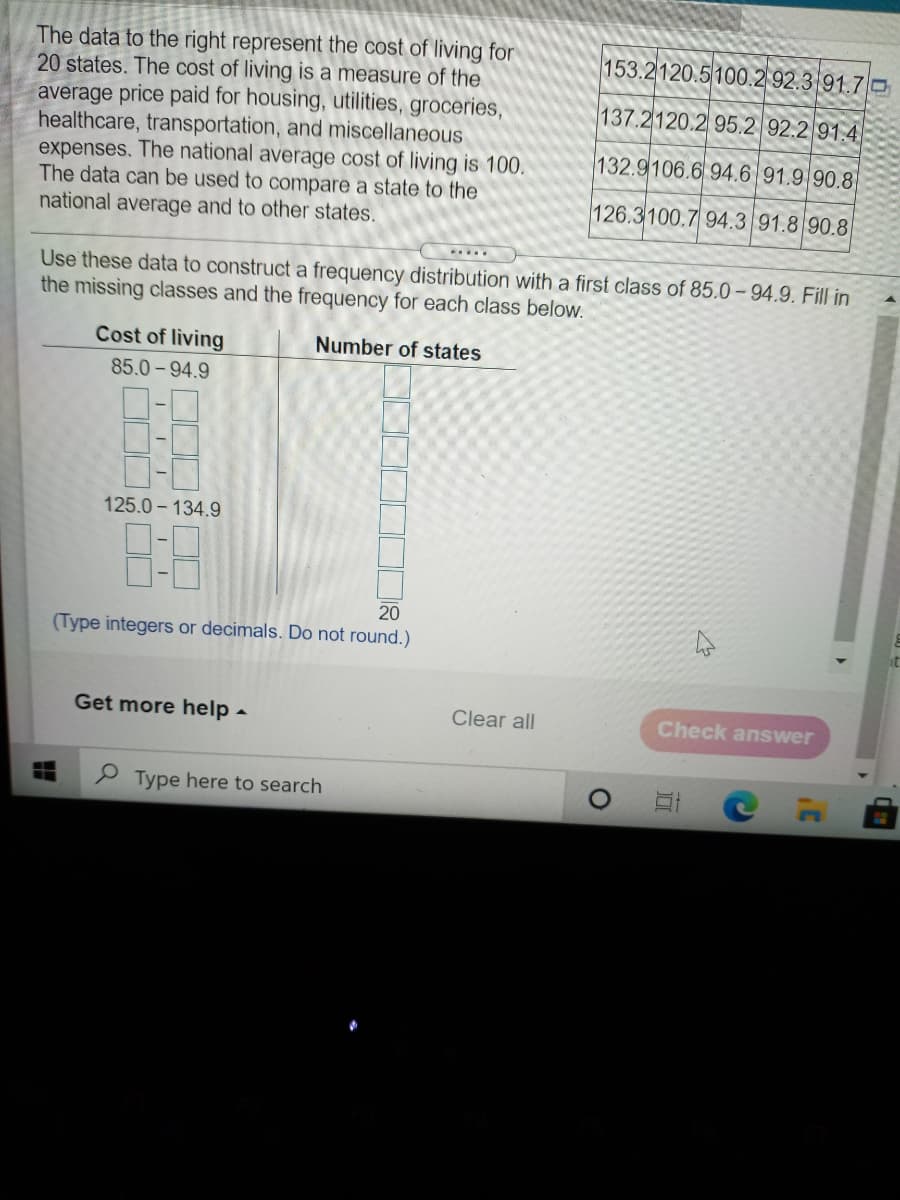
Transcribed Image Text:The data to the right represent the cost of living for
20 states. The cost of living is a measure of the
average price paid for housing, utilities, groceries,
healthcare, transportation, and miscellaneous
expenses. The national average cost of living is 100.
The data can be used to compare a state to the
national average and to other states.
153.2120.5100.2 92.3 91.7 O
137.2120.2 95.2 92.2 91.4
132.9106.6 94.6 91.9 90.8
126.3100.7 94.3 91.8 90.8
...
Use these data to construct a frequency distribution with a first class of 85.0 – 94.9. Fill in
the missing classes and the frequency for each class below.
Cost of living
Number of states
85.0-94.9
125.0 - 134.9
8:8
20
(Type integers or decimals. Do not round.)
Get more help -
Clear all
Check answer
P Type here to search
Expert Solution
This question has been solved!
Explore an expertly crafted, step-by-step solution for a thorough understanding of key concepts.

This is a popular solution!

Trending now
This is a popular solution!

Step by step
Solved in 2 steps

Recommended textbooks for you
Glencoe Algebra 1, Student Edition, 9780079039897…
Algebra
ISBN:
9780079039897
Author:
Carter
Publisher:
McGraw Hill

Holt Mcdougal Larson Pre-algebra: Student Edition…
Algebra
ISBN:
9780547587776
Author:
HOLT MCDOUGAL
Publisher:
HOLT MCDOUGAL

Big Ideas Math A Bridge To Success Algebra 1: Stu…
Algebra
ISBN:
9781680331141
Author:
HOUGHTON MIFFLIN HARCOURT
Publisher:
Houghton Mifflin Harcourt
Glencoe Algebra 1, Student Edition, 9780079039897…
Algebra
ISBN:
9780079039897
Author:
Carter
Publisher:
McGraw Hill
Holt Mcdougal Larson Pre-algebra: Student Edition…
Algebra
ISBN:
9780547587776
Author:
HOLT MCDOUGAL
Publisher:
HOLT MCDOUGAL
Big Ideas Math A Bridge To Success Algebra 1: Stu…
Algebra
ISBN:
9781680331141
Author:
HOUGHTON MIFFLIN HARCOURT
Publisher:
Houghton Mifflin Harcourt