The department of health studied the number of patients who need liver transplantation. The following data are the Liver Transplantation Waiting List (LTWL), where y is the size (in number of patients) and x is the corresponding year: 1339 1877 2978 3961 5046 7103 7932 7882 8028 8763 8755 8939 9203 x 2000 2001 2002 2003 2004 2005 2006 2007 2008 2009 2010 2011 2012 y Round your intermediate answers to four decimal places (e.g. 98.7654). (a) Fit the simple linear regression model using the method of least squares. Find the estimate of o². Round your answer to the nearest integer (e.g. 9876). i (b) How does the LTWL size change in average for a year? Round your answer to the nearest integer (e.g. 9876). i (c) Estimate the number of patients in the list in 2014.
The department of health studied the number of patients who need liver transplantation. The following data are the Liver Transplantation Waiting List (LTWL), where y is the size (in number of patients) and x is the corresponding year: 1339 1877 2978 3961 5046 7103 7932 7882 8028 8763 8755 8939 9203 x 2000 2001 2002 2003 2004 2005 2006 2007 2008 2009 2010 2011 2012 y Round your intermediate answers to four decimal places (e.g. 98.7654). (a) Fit the simple linear regression model using the method of least squares. Find the estimate of o². Round your answer to the nearest integer (e.g. 9876). i (b) How does the LTWL size change in average for a year? Round your answer to the nearest integer (e.g. 9876). i (c) Estimate the number of patients in the list in 2014.

Functions and Change: A Modeling Approach to College Algebra (MindTap Course List)
6th Edition
ISBN:9781337111348
Author:Bruce Crauder, Benny Evans, Alan Noell
Publisher:Bruce Crauder, Benny Evans, Alan Noell
Chapter5: A Survey Of Other Common Functions
Section5.3: Modeling Data With Power Functions
Problem 6E: Urban Travel Times Population of cities and driving times are related, as shown in the accompanying...

Related questions
Question
Answer asap
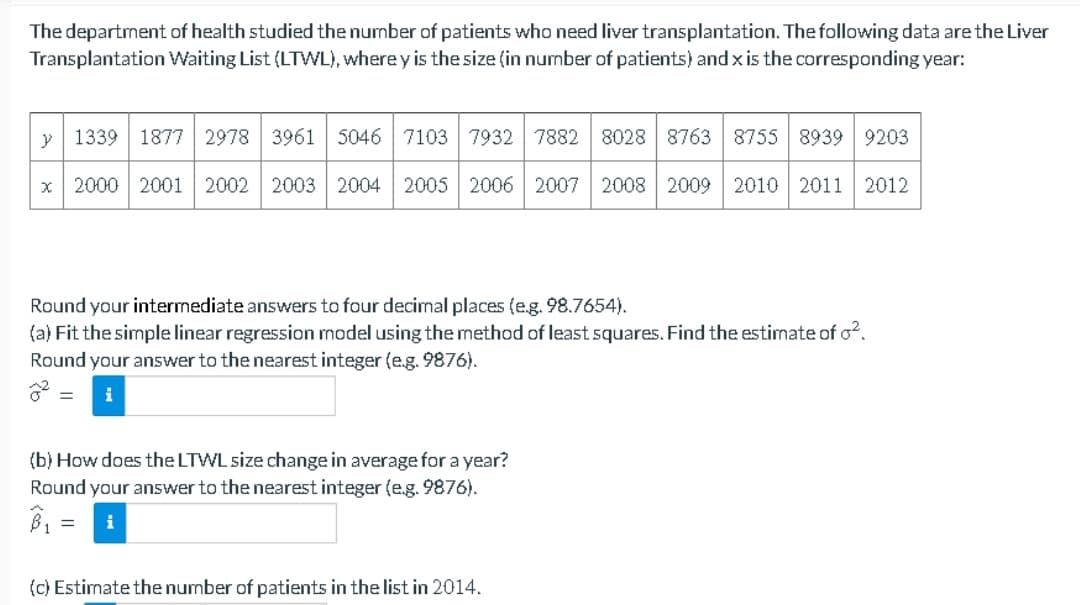
Transcribed Image Text:The department of health studied the number of patients who need liver transplantation. The following data are the Liver
Transplantation Waiting List (LTWL), where y is the size (in number of patients) and x is the corresponding year:
1339 1877 2978 3961 5046 7103 7932 7882 8028 8763 8755 8939 9203
x 2000 2001 2002 2003 2004 2005 2006 2007 2008 2009 2010 2011 2012
y
Round your intermediate answers to four decimal places (e.g. 98.7654).
(a) Fit the simple linear regression model using the method of least squares. Find the estimate of o².
Round your answer to the nearest integer (e.g. 9876).
i
=
(b) How does the LTWL size change in average for a year?
Round your answer to the nearest integer (e.g. 9876).
B₁:
= i
(c) Estimate the number of patients in the list in 2014.
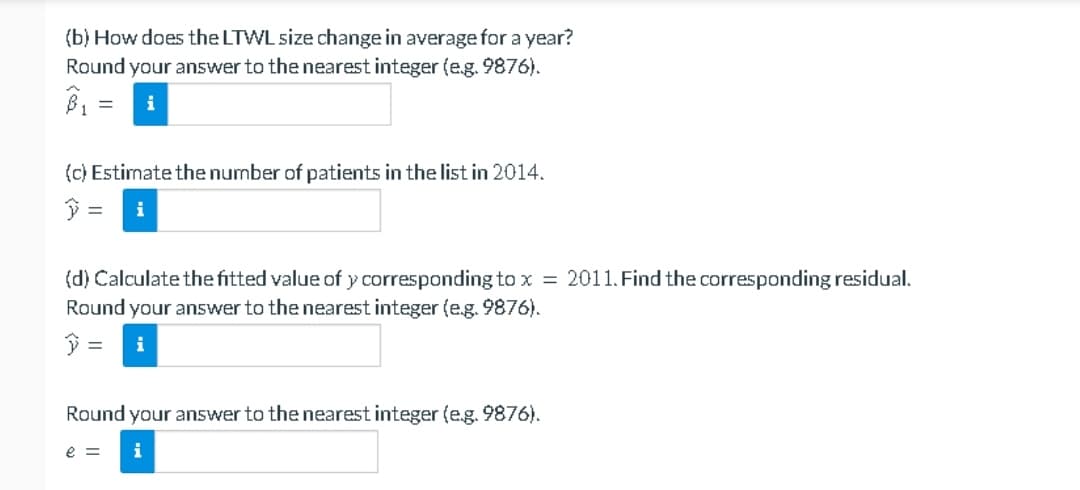
Transcribed Image Text:(b) How does the LTWL size change in average for a year?
Round your answer to the nearest integer (e.g. 9876).
= i
B₁
(c) Estimate the number of patients in the list in 2014.
y = i
(d) Calculate the fitted value of y corresponding to x = 2011. Find the corresponding residual.
Round your answer to the nearest integer (e.g. 9876).
=
Round your answer to the nearest integer (e.g. 9876).
e = i
Expert Solution
This question has been solved!
Explore an expertly crafted, step-by-step solution for a thorough understanding of key concepts.

Step by step
Solved in 2 steps with 2 images

Recommended textbooks for you
Functions and Change: A Modeling Approach to Coll…
Algebra
ISBN:
9781337111348
Author:
Bruce Crauder, Benny Evans, Alan Noell
Publisher:
Cengage Learning

Glencoe Algebra 1, Student Edition, 9780079039897…
Algebra
ISBN:
9780079039897
Author:
Carter
Publisher:
McGraw Hill
Functions and Change: A Modeling Approach to Coll…
Algebra
ISBN:
9781337111348
Author:
Bruce Crauder, Benny Evans, Alan Noell
Publisher:
Cengage Learning
Glencoe Algebra 1, Student Edition, 9780079039897…
Algebra
ISBN:
9780079039897
Author:
Carter
Publisher:
McGraw Hill