The desired percentage of Sio, in a certain type of aluminous cement is 5.5. To test whether the true average percentage is 5.5 for a particular production facility, 16 independently obtained samples are analyzed. Suppose ample is normally distributed witha = 0.32 and that x = 5.23. (Use a = 0.05.) (a) Does this indicate conclusively that the true average percentage differs from 5.5? State the appropriate null and alternative hypotheses. Ο H 5.5 Hgiµ 2 5.5 Ο Η,:μ5.5 Hi µ < 5.5 • Ho: H = 5.5 Hgiµ = 5.5 O Hoi H = 5.5 Hi# > 5.5 Calculate the test statistic and determine the P-value. (Round your test statistic to two decimal places and your P-value to four decimal places.) P-value = State the conclusion in the problem context. O Do not reject the null hypothesis. There is not sufficient evidence to conclude that the true average percentage differs from the desired percentage. • Reject the null hypothesis. There is sufficient evidence to conclude that the true average percentage differs from the desired percentage. O Reject the null hypothesis. There is not sufficient evidence to conclude that the true average percentage differs from the desired percentage. O Do not reject the null hypothesis. There is sufficient evidence to conclude that the true average percentage differs from the desired percentage.
The desired percentage of Sio, in a certain type of aluminous cement is 5.5. To test whether the true average percentage is 5.5 for a particular production facility, 16 independently obtained samples are analyzed. Suppose ample is normally distributed witha = 0.32 and that x = 5.23. (Use a = 0.05.) (a) Does this indicate conclusively that the true average percentage differs from 5.5? State the appropriate null and alternative hypotheses. Ο H 5.5 Hgiµ 2 5.5 Ο Η,:μ5.5 Hi µ < 5.5 • Ho: H = 5.5 Hgiµ = 5.5 O Hoi H = 5.5 Hi# > 5.5 Calculate the test statistic and determine the P-value. (Round your test statistic to two decimal places and your P-value to four decimal places.) P-value = State the conclusion in the problem context. O Do not reject the null hypothesis. There is not sufficient evidence to conclude that the true average percentage differs from the desired percentage. • Reject the null hypothesis. There is sufficient evidence to conclude that the true average percentage differs from the desired percentage. O Reject the null hypothesis. There is not sufficient evidence to conclude that the true average percentage differs from the desired percentage. O Do not reject the null hypothesis. There is sufficient evidence to conclude that the true average percentage differs from the desired percentage.

A First Course in Probability (10th Edition)
10th Edition
ISBN:9780134753119
Author:Sheldon Ross
Publisher:Sheldon Ross
Chapter1: Combinatorial Analysis
Section: Chapter Questions
Problem 1.1P: a. How many different 7-place license plates are possible if the first 2 places are for letters and...

Related questions
Question
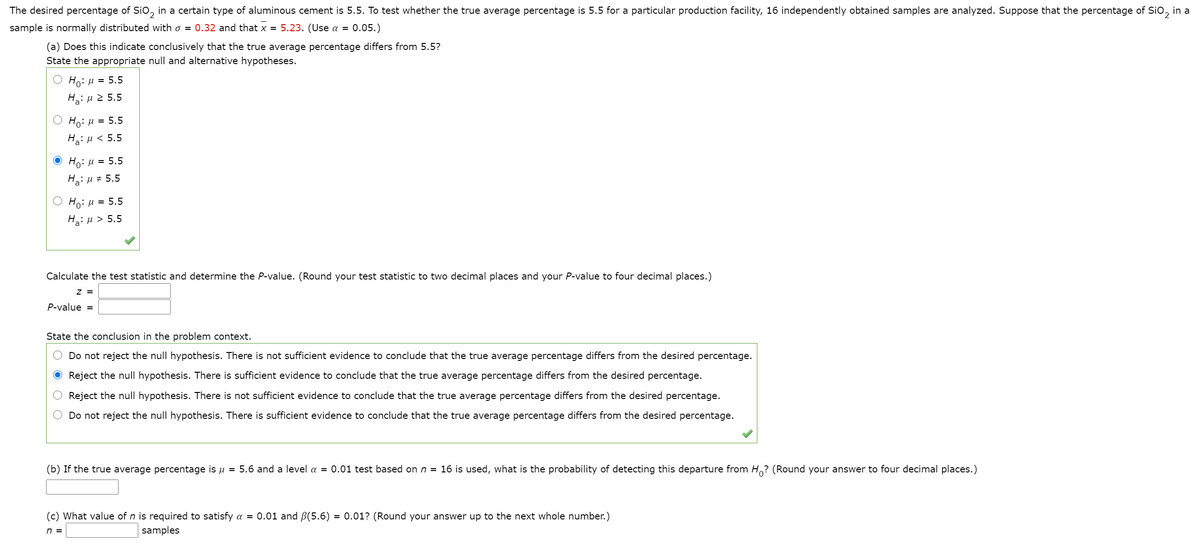
Transcribed Image Text:The desired percentage of Sio, in a certain type of aluminous cement is 5.5. To test whether the true average percentage is 5.5 for a particular production facility, 16 independently obtained samples are analyzed. Suppose that the percentage of Sio, in a
sample is normally distributed with o = 0.32 and that x = 5.23. (Use a = 0.05.)
(a) Does this indicate conclusively that the true average percentage differs from 5.5?
State the appropriate null and alternative hypotheses.
Ho: u = 5.5
Hg: µ 2 5.5
Ho: H
= 5.5
HaiH< 5.5
Ο H, μ 5.5
H: µ # 5.5
Ο H: μ- 5.5
Hai u > 5.5
=
Calculate the test statistic and determine the P-value. (Round your test statistic to two decimal places and your P-value to four decimal places.)
z =
P-value =
State the conclusion in the problem context.
Do not reject the null hypothesis. There is not sufficient evidence to conclude that the true average percentage differs from the desired percentage.
O Reject the null hypothesis. There is sufficient evidence to conclude that the true average percentage differs from the desired percentage.
Reject the null hypothesis. There is not sufficient evidence to conclude that the true average percentage differs from the desired percentage.
Do not reject the null hypothesis. There is sufficient evidence to conclude that the true average percentage differs from the desired percentage.
(b) If the true average percentage is u = 5.6 and a level a = 0.01 test based on n = 16 is used, what is the probability of detecting this departure from H? (Round your answer to four decimal places.)
(c) What value of n is required to satisfy a = 0.01 and B(5.6) = 0.01? (Round your answer up to the next whole number.)
n =
samples
Expert Solution
This question has been solved!
Explore an expertly crafted, step-by-step solution for a thorough understanding of key concepts.

Step by step
Solved in 5 steps with 2 images

Knowledge Booster


Learn more about
Need a deep-dive on the concept behind this application? Look no further. Learn more about this topic, probability and related others by exploring similar questions and additional content below.Recommended textbooks for you
A First Course in Probability (10th Edition)
Probability
ISBN:
9780134753119
Author:
Sheldon Ross
Publisher:
PEARSON

A First Course in Probability (10th Edition)
Probability
ISBN:
9780134753119
Author:
Sheldon Ross
Publisher:
PEARSON