The desired percentage of Sio, in a certain type of aluminous cement is 5.5. To test whether the true average percentage is 5.5 for a particular production facility, 16 independently obtained samples are analyzed. Suppose that the percentage of SiO, in a sample is normally distributed with o = 0.32 and that x = 5.22. (Use a = 0.05.) (a) Does this indicate conclusively that the true average percentage differs from 5.5? State the appropriate null and alternative hypotheses. O Ho: H = 5.5 H: u< 5.5 O Ho: H = 5.5 H: u2 5.5 O Ho: H = 5.5 Hg: H # 5.5 O Ho: H = 5.5 H: 4 > 5.5 Calculate the test statistic and determine the P-value. (Round your test statistic to two decimal places and your P-value to four decimal places.) z = -3,50 P-value = 0.0004 State the conclusion in the problem context. O Reject the null hypothesis. There is sufficient evidence to conclude that the true average percentage differs from the desired percentage. O Do not reject the null hypothesis. There is sufficient evidence to conclude that the true average percentage differs from the desired percentage. O Do not reject the null hypothesis. There is not sufficient evidence to conclude that the true average percentage differs from the desired percentage. OReject the null hypothesis. There is not sufficient evidence to conclude that the true average percentage differs from the desired percentage. (b) If the true average percentage is u = 5.6 and a level a = 0.01 test based on n = 16 is used, what is the probability of detecting this departure from H.? (Round your answer to four decimal places.) (c) What value of n is required to satisfy a = 0.01 and B(5.6) = 0.01? (Round your answer up to the next whole number.) n = samples
The desired percentage of Sio, in a certain type of aluminous cement is 5.5. To test whether the true average percentage is 5.5 for a particular production facility, 16 independently obtained samples are analyzed. Suppose that the percentage of SiO, in a sample is normally distributed with o = 0.32 and that x = 5.22. (Use a = 0.05.) (a) Does this indicate conclusively that the true average percentage differs from 5.5? State the appropriate null and alternative hypotheses. O Ho: H = 5.5 H: u< 5.5 O Ho: H = 5.5 H: u2 5.5 O Ho: H = 5.5 Hg: H # 5.5 O Ho: H = 5.5 H: 4 > 5.5 Calculate the test statistic and determine the P-value. (Round your test statistic to two decimal places and your P-value to four decimal places.) z = -3,50 P-value = 0.0004 State the conclusion in the problem context. O Reject the null hypothesis. There is sufficient evidence to conclude that the true average percentage differs from the desired percentage. O Do not reject the null hypothesis. There is sufficient evidence to conclude that the true average percentage differs from the desired percentage. O Do not reject the null hypothesis. There is not sufficient evidence to conclude that the true average percentage differs from the desired percentage. OReject the null hypothesis. There is not sufficient evidence to conclude that the true average percentage differs from the desired percentage. (b) If the true average percentage is u = 5.6 and a level a = 0.01 test based on n = 16 is used, what is the probability of detecting this departure from H.? (Round your answer to four decimal places.) (c) What value of n is required to satisfy a = 0.01 and B(5.6) = 0.01? (Round your answer up to the next whole number.) n = samples

MATLAB: An Introduction with Applications
6th Edition
ISBN:9781119256830
Author:Amos Gilat
Publisher:Amos Gilat
Chapter1: Starting With Matlab
Section: Chapter Questions
Problem 1P

Related questions
Question
100%
Please answer the last three questions. Thanks
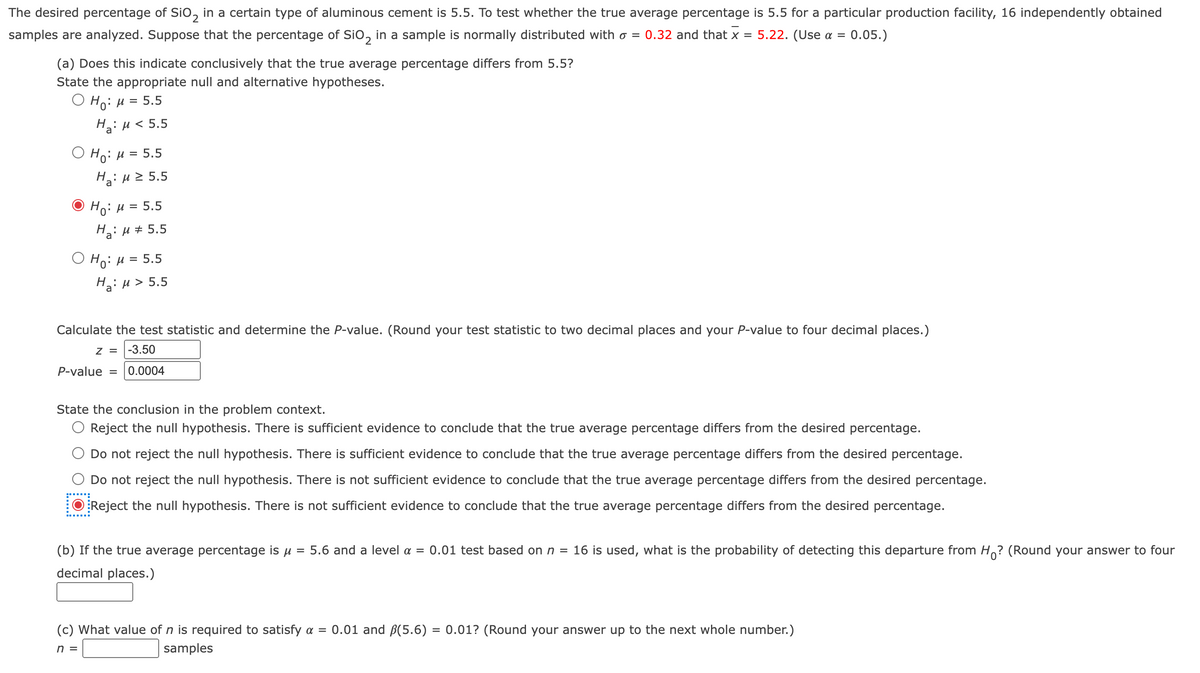
Transcribed Image Text:The desired percentage of Sio, in a certain type of aluminous cement is 5.5. To test whether the true average percentage is 5.5 for a particular production facility, 16 independently obtained
samples are analyzed. Suppose that the percentage of Sio, in a sample is normally distributed with o = 0.32 and that x =
5.22. (Use a =
:0.05.)
(a) Does this indicate conclusively that the true average percentage differs from 5.5?
State the appropriate null and alternative hypotheses.
О н: и 3 5.5
Hai H < 5.5
O Ho: µ = 5.5
Ha: u 2 5.5
Ho: H = 5.5
Hai H + 5.5
Ο H μ 5.5
Hai H> 5.5
H.:
Calculate the test statistic and determine the P-value. (Round your test statistic to two decimal places and your P-value to four decimal places.)
Z = |-3.50
P-value = 0.0004
State the conclusion in the problem context.
Reject the null hypothesis. There is sufficient evidence to conclude that the true average percentage differs from the desired percentage.
Do not reject the null hypothesis. There is sufficient evidence to conclude that the true average percentage differs from the desired percentage.
Do not reject the null hypothesis. There is not sufficient evidence to conclude that the true average percentage differs from the desired percentage.
Reject the null hypothesis. There is not sufficient evidence to conclude that the true average percentage differs from the desired percentage.
(b) If the true average percentage is u
5.6 and a level a = 0.01 test based on n = 16 is used, what is the probability of detecting this departure from H? (Round your answer to four
decimal places.)
(c) What value of n is required to satisfy a = 0.01 and ßB(5.6) = 0.01? (Round your answer up to the next whole number.)
n =
samples
Expert Solution
This question has been solved!
Explore an expertly crafted, step-by-step solution for a thorough understanding of key concepts.

This is a popular solution!

Trending now
This is a popular solution!

Step by step
Solved in 3 steps with 5 images

Recommended textbooks for you
MATLAB: An Introduction with Applications
Statistics
ISBN:
9781119256830
Author:
Amos Gilat
Publisher:
John Wiley & Sons Inc

Probability and Statistics for Engineering and th…
Statistics
ISBN:
9781305251809
Author:
Jay L. Devore
Publisher:
Cengage Learning

Statistics for The Behavioral Sciences (MindTap C…
Statistics
ISBN:
9781305504912
Author:
Frederick J Gravetter, Larry B. Wallnau
Publisher:
Cengage Learning
MATLAB: An Introduction with Applications
Statistics
ISBN:
9781119256830
Author:
Amos Gilat
Publisher:
John Wiley & Sons Inc
Probability and Statistics for Engineering and th…
Statistics
ISBN:
9781305251809
Author:
Jay L. Devore
Publisher:
Cengage Learning
Statistics for The Behavioral Sciences (MindTap C…
Statistics
ISBN:
9781305504912
Author:
Frederick J Gravetter, Larry B. Wallnau
Publisher:
Cengage Learning

Elementary Statistics: Picturing the World (7th E…
Statistics
ISBN:
9780134683416
Author:
Ron Larson, Betsy Farber
Publisher:
PEARSON

The Basic Practice of Statistics
Statistics
ISBN:
9781319042578
Author:
David S. Moore, William I. Notz, Michael A. Fligner
Publisher:
W. H. Freeman

Introduction to the Practice of Statistics
Statistics
ISBN:
9781319013387
Author:
David S. Moore, George P. McCabe, Bruce A. Craig
Publisher:
W. H. Freeman