The efficiency for a steel specimen immersed in a phosphating tank is the weight of the phosphate coating divided by the metal loss (both in mg/ft2). An article gave the accompanying data on tank temperature (x) and efficiency ratio (y). Temp. 173 175 176 177 177 178 179 180 Ratio 0.86 1.37 1.32 1.13 0.97 1.10 1.10 1.78 Temp. 183 183 183 183 183 184 184 185 Ratio 1.47 1.54 1.53 2.15 2.05 0.80 1.39 0.96 Temp. 185 185 185 187 187 188 189 191 Ratio 1.73 2.00 2.70 1.45 2.42 3.10 1.79 3.10 (a) Determine the equation of the estimated regression line. (Round all numerical values to four decimal places.) y = (b) Calculate a point estimate for true average efficiency ratio when tank temperature is 185. (Round your answer to four decimal places.) (c) Calculate the values of the residuals from the least squares line for the four observations for which temperature is 185. (Round your answers to two decimal places.) (185, 0.96)(185, 1.73)(185, 2.00)(185, 2.70) Why do they not all have the same sign? These residuals do not all have the same sign because
The efficiency for a steel specimen immersed in a phosphating tank is the weight of the phosphate coating divided by the metal loss (both in mg/ft2). An article gave the accompanying data on tank temperature (x) and efficiency ratio (y). Temp. 173 175 176 177 177 178 179 180 Ratio 0.86 1.37 1.32 1.13 0.97 1.10 1.10 1.78 Temp. 183 183 183 183 183 184 184 185 Ratio 1.47 1.54 1.53 2.15 2.05 0.80 1.39 0.96 Temp. 185 185 185 187 187 188 189 191 Ratio 1.73 2.00 2.70 1.45 2.42 3.10 1.79 3.10 (a) Determine the equation of the estimated regression line. (Round all numerical values to four decimal places.) y = (b) Calculate a point estimate for true average efficiency ratio when tank temperature is 185. (Round your answer to four decimal places.) (c) Calculate the values of the residuals from the least squares line for the four observations for which temperature is 185. (Round your answers to two decimal places.) (185, 0.96)(185, 1.73)(185, 2.00)(185, 2.70) Why do they not all have the same sign? These residuals do not all have the same sign because

Functions and Change: A Modeling Approach to College Algebra (MindTap Course List)
6th Edition
ISBN:9781337111348
Author:Bruce Crauder, Benny Evans, Alan Noell
Publisher:Bruce Crauder, Benny Evans, Alan Noell
Chapter3: Straight Lines And Linear Functions
Section3.CR: Chapter Review Exercises
Problem 16CR: XYZ Corporation Stock Prices The following table shows the average stock price, in dollars, of XYZ...

Related questions
Question
The efficiency for a steel specimen immersed in a phosphating tank is the weight of the phosphate coating divided by the metal loss (both in mg/ft2). An article gave the accompanying data on tank temperature (x) and efficiency ratio (y).
| Temp. | 173 | 175 | 176 | 177 | 177 | 178 | 179 | 180 |
|---|---|---|---|---|---|---|---|---|
| Ratio | 0.86 | 1.37 | 1.32 | 1.13 | 0.97 | 1.10 | 1.10 | 1.78 |
| Temp. | 183 | 183 | 183 | 183 | 183 | 184 | 184 | 185 |
|---|---|---|---|---|---|---|---|---|
| Ratio | 1.47 | 1.54 | 1.53 | 2.15 | 2.05 | 0.80 | 1.39 | 0.96 |
| Temp. | 185 | 185 | 185 | 187 | 187 | 188 | 189 | 191 |
|---|---|---|---|---|---|---|---|---|
| Ratio | 1.73 | 2.00 | 2.70 | 1.45 | 2.42 | 3.10 | 1.79 | 3.10 |
(a)
Determine the equation of the estimated regression line. (Round all numerical values to four decimal places.)
y =
(b)
Calculate a point estimate for true average efficiency ratio when tank temperature is 185. (Round your answer to four decimal places.)
(c)
Calculate the values of the residuals from the least squares line for the four observations for which temperature is 185. (Round your answers to two decimal places.)
(185, 0.96)(185, 1.73)(185, 2.00)(185, 2.70)
Why do they not all have the same sign?
These residuals do not all have the same sign because in the case of the third pair of observations, the observed efficiency ratio was equal to the predicted value. In the cases of the other pairs of observations, the observed efficiency ratios were smaller than the predicted value. These residuals do not all have the same sign because in the case of the second pair of observations, the observed efficiency ratio was equal to the predicted value. In the cases of the other pairs of observations, the observed efficiency ratios were larger than the predicted value. These residuals do not all have the same sign because in the cases of the first two pairs of observations, the observed efficiency ratios were smaller than the predicted value. In the cases of the last two pairs of observations, the observed efficiency ratios were larger than the predicted value. These residuals do not all have the same sign because in the cases of the first two pairs of observations, the observed efficiency ratios were larger than the predicted value. In the cases of the last two pairs of observations, the observed efficiency ratios were smaller than the predicted value.
(d)
What proportion of the observed variation in efficiency ratio can be attributed to the simple linear regression relationship between the two variables? (Round your answer to three decimal places.)
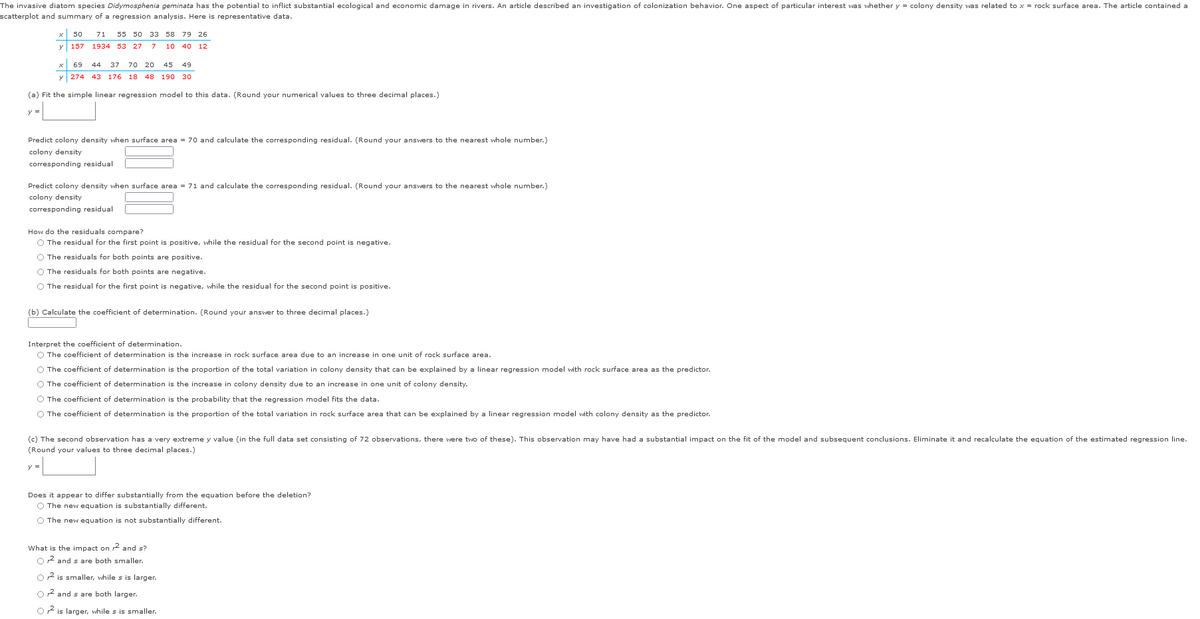
Transcribed Image Text:The invasive diatom species Didymosphenia geminata has the potential to inflict substantial ecological and economic damage in rivers. An article described an investigation of colonization behavior. One aspect of particular interest was whether y = colony density was related to x = rock surface area. The article contained a
scatterplot and summary of a regression analysis. Here is representative data.
50 71
55 50 33 58 79 26
y 157 1934 53 27 7 10 40 12
x 69 44 37 70 20 45 49
y 274 43 176 18 48 190 30
(a) Fit the simple linear regression model to this data. (Round your numerical values to three decimal places.)
y =
Predict colony density when surface area = 70 and calculate the corresponding residual. (Round your answers to the nearest whole number.)
colony density
corresponding residual
Predict colony density when surface area = 71 and calculate the corresponding residual. (Round your answers to the nearest whole number.)
colony density
corresponding residual
How do the residuals compare?
O The residual for the first point is positive, while the residual for the second point is negative.
O The residuals for both points are positive.
O The residuals for both points are negative.
O The residual for the first point is negative, while the residual for the second point is positive.
(b) Calculate the coefficient of determination. (Round your answer to three decimal places.)
Interpret the coefficient of determination.
O The coefficient of determination is the increase in rock surface area due to an increase in one unit of rock surface area.
O The coefficient of determination is the proportion of the total variation in colony density that can be explained by a linear regression model with rock surface area as the predictor.
O The coefficient of determination is the increase in colony density due to an increase in one unit of colony density.
O The coefficient of determination is the probability that the regression model fits the data.
O The coefficient of determination is the proportion of the total variation in rock surface area that can be explained by a linear regression model with colony density as the predictor.
(c) The second observation has a very extreme y value (in the full data set consisting of 72 observations, there were two of these). This observation may have had a substantial impact on the fit of the model and subsequent conclusions. Eliminate it and recalculate the equation of the estimated regression line.
(Round your values to three decimal places.)
Does it appear to differ substantially from the equation before the deletion?
O The new equation is substantially different.
O The new equation is not substantially different.
What is the impact on 2 and s?
O² and s are both smaller.
O2 is smaller, while s is larger.
O² and s are both larger.
O2 is larger, while s is smaller.
Expert Solution
This question has been solved!
Explore an expertly crafted, step-by-step solution for a thorough understanding of key concepts.

This is a popular solution!

Trending now
This is a popular solution!

Step by step
Solved in 2 steps with 2 images

Recommended textbooks for you
Functions and Change: A Modeling Approach to Coll…
Algebra
ISBN:
9781337111348
Author:
Bruce Crauder, Benny Evans, Alan Noell
Publisher:
Cengage Learning

Algebra and Trigonometry (MindTap Course List)
Algebra
ISBN:
9781305071742
Author:
James Stewart, Lothar Redlin, Saleem Watson
Publisher:
Cengage Learning

Glencoe Algebra 1, Student Edition, 9780079039897…
Algebra
ISBN:
9780079039897
Author:
Carter
Publisher:
McGraw Hill
Functions and Change: A Modeling Approach to Coll…
Algebra
ISBN:
9781337111348
Author:
Bruce Crauder, Benny Evans, Alan Noell
Publisher:
Cengage Learning
Algebra and Trigonometry (MindTap Course List)
Algebra
ISBN:
9781305071742
Author:
James Stewart, Lothar Redlin, Saleem Watson
Publisher:
Cengage Learning
Glencoe Algebra 1, Student Edition, 9780079039897…
Algebra
ISBN:
9780079039897
Author:
Carter
Publisher:
McGraw Hill
