The efficiency for a steel specimen immersed in a phosphating tank is the weight of the phosphate coating divided by the metal loss (both in mg/ft). An article gave the accompanying data on tank temperature (x) and efficiency ratio (y). Тemp. 171 173 174 175 175 176 177 178 0.86 1.29 1.40 1.05 1.01 1.04 0.94 1.78 Ratio Теmp. 181 181 181| 181 182 182 183 181 1.63 2.03 2.07| 0.76 1.47 0.84 Ratio 1.41 1.56 Temp. 183 183 185 183 185 186 187 189 1.75 1.92 1.81 3.16 Ratio 2.64 1.39 2.58 2.90 A USE SALT (a) Determine the equation of the estimated regression line. (Round all numerical values to four decimal places.) (b) Calculate a point estimate for true average efficiency ratio when tank temperature is 183. (Round your answer to four decimal places.) (e) Calculate the values of the residuals from the least squares line for the four observations for which temperature is 183. (Round your answers to two decimal places.) (183, 0.84) (183, 1.75) (183, 1.92) (183, 2.64) Why do they not all have the same sign? O These residuals do not all have the same sign because in the cases of the first two pairs of observations, the observed efficiency ratios were larger than the predicted value. In the cases of the last two pairs of observations, the observed efficiency ratios were smaller than the predicted value. O These residuals do not all have the same sign because in the case of the second pair of observations, the observed efficiency ratio was equal to the predicted value. In the cases of the other pairs of observations, the observed efficiency ratios were larger than the predicted value. O These residuals do not all have the same sign because in the cases of the first two pairs of observations, the observed efficiency ratios were smaller than the predicted value. In the cases of the last two pairs of observations, the observed efficiency ratios were larger than the predicted value. O These residuals do not all have the same sign because in the case of the third pair of observations, the observed efficiency ratio was equal to the predicted value. In the cases of the other pairs of observations, the observed efficiency ratios were smaller than the predicted value.
The efficiency for a steel specimen immersed in a phosphating tank is the weight of the phosphate coating divided by the metal loss (both in mg/ft). An article gave the accompanying data on tank temperature (x) and efficiency ratio (y). Тemp. 171 173 174 175 175 176 177 178 0.86 1.29 1.40 1.05 1.01 1.04 0.94 1.78 Ratio Теmp. 181 181 181| 181 182 182 183 181 1.63 2.03 2.07| 0.76 1.47 0.84 Ratio 1.41 1.56 Temp. 183 183 185 183 185 186 187 189 1.75 1.92 1.81 3.16 Ratio 2.64 1.39 2.58 2.90 A USE SALT (a) Determine the equation of the estimated regression line. (Round all numerical values to four decimal places.) (b) Calculate a point estimate for true average efficiency ratio when tank temperature is 183. (Round your answer to four decimal places.) (e) Calculate the values of the residuals from the least squares line for the four observations for which temperature is 183. (Round your answers to two decimal places.) (183, 0.84) (183, 1.75) (183, 1.92) (183, 2.64) Why do they not all have the same sign? O These residuals do not all have the same sign because in the cases of the first two pairs of observations, the observed efficiency ratios were larger than the predicted value. In the cases of the last two pairs of observations, the observed efficiency ratios were smaller than the predicted value. O These residuals do not all have the same sign because in the case of the second pair of observations, the observed efficiency ratio was equal to the predicted value. In the cases of the other pairs of observations, the observed efficiency ratios were larger than the predicted value. O These residuals do not all have the same sign because in the cases of the first two pairs of observations, the observed efficiency ratios were smaller than the predicted value. In the cases of the last two pairs of observations, the observed efficiency ratios were larger than the predicted value. O These residuals do not all have the same sign because in the case of the third pair of observations, the observed efficiency ratio was equal to the predicted value. In the cases of the other pairs of observations, the observed efficiency ratios were smaller than the predicted value.

Functions and Change: A Modeling Approach to College Algebra (MindTap Course List)
6th Edition
ISBN:9781337111348
Author:Bruce Crauder, Benny Evans, Alan Noell
Publisher:Bruce Crauder, Benny Evans, Alan Noell
Chapter5: A Survey Of Other Common Functions
Section5.3: Modeling Data With Power Functions
Problem 6E: Urban Travel Times Population of cities and driving times are related, as shown in the accompanying...

Related questions
Question
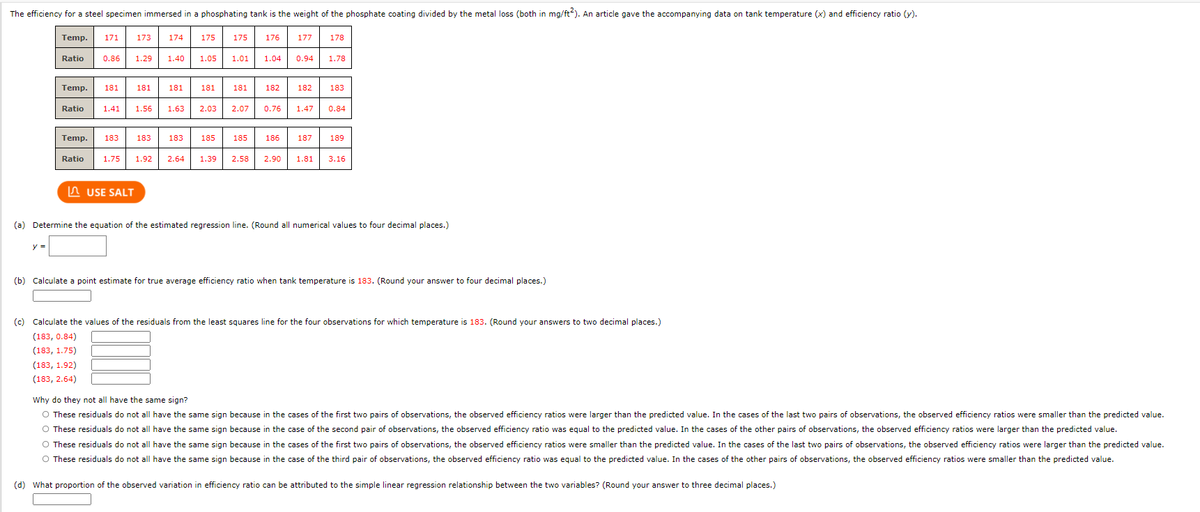
Transcribed Image Text:The efficiency for a steel specimen immersed in a phosphating tank is the weight of the phosphate coating divided by the metal loss (both in mg/ft). An article gave the accompanying data on tank temperature (x) and efficiency ratio (y).
Temp.
171
173
174
175
175
176
177
178
Ratio
0.86
1.29
1.40
1.05
1.01
1.04
0.94
1.78
Temp.
181
181
181
181
181
182
182
183
Ratio
1.41
1.56
1.63
2.03
2.07
0.76
1.47
0.84
Temp.
183
183
183
185
185
186
187
189
Ratio
1.75
1.92
2.64
1.39
2.58
2.90
1.81
3.16
A USE SALT
(a) Determine the equation of the estimated regression line. (Round all numerical values to four decimal places.)
y =
(b) Calculate a point estimate for true average efficiency ratio when tank temperature is 183. (Round your answer to four decimal places.)
(c) Calculate the values of the residuals from the least squares line for the four observations for which temperature is 183. (Round your answers to two decimal places.)
(183, 0.84)
(183, 1.75)
(183, 1.92)
(183, 2.64)
Why do they not all have the same sign?
O These residuals do not all have the same sign because in the cases of the first two pairs of observations, the observed efficiency ratios were larger than the predicted value. In the cases of the last two pairs of observations, the observed efficiency ratios were smaller than the predicted value.
O These residuals do not all have the same sign because in the case of the second pair of observations, the observed efficiency ratio was equal to the predicted value. In the cases of the other pairs of observations, the observed efficiency ratios were larger than the predicted value.
These residuals do not all have the same sign because in the cases of the first two pairs of observations, the observed efficiency ratios were smaller than the predicted value. In the cases of the last two pairs of observations, the observed efficiency ratios were larger than the predicted value.
O These residuals do not all have the same sign because in the case of the third pair of observations, the observed efficiency ratio was equal to the predicted value. In the cases of the other pairs of observations, the observed efficiency ratios were smaller than the predicted value.
(d) What proportion of the observed variation in efficiency ratio can be attributed to the simple linear regression relationship between the two variables? (Round your answer to three decimal places.)
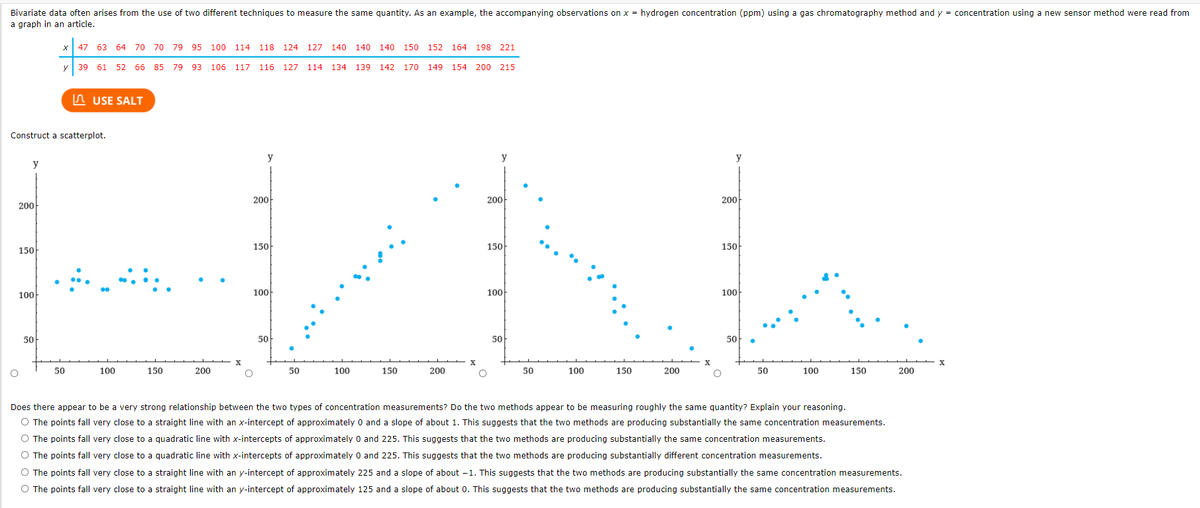
Transcribed Image Text:Bivariate data often arises from the use of two different techniques to measure the same quantity. As an example, the accompanying observations on x = hydrogen concentration (ppm) using a gas chromatography method and y = concentration using a new sensor method were read from
a graph in an article.
47 63 64 70 70 79 95 100 114 118 124
127 140 140 140 150
152 164 198 221
y
39 61 52 66 85 79 93 106 117 116 127 114 134 139 142 170 149 154 200 215
n USE SALT
Construct a scatterplot.
y
y
y
y
200
200
200
200
150
150-
150
150
100
100
100
100-
50
50
50-
50
- x
50
100
150
200
50
100
150
200
50
100
150
200
50
100
150
200
Does there appear to be a very strong relationship between the two types of concentration measurements? Do the two methods appear to be measuring roughly the same quantity? Explain your reasoning.
O The points fall very close to a straight line with an x-intercept of approximately 0 and a slope of about 1. This suggests that the two methods are producing substantially the same concentration measurements.
O The points fall very close to a quadratic line with x-intercepts of approximately 0 and 225. This suggests that the two methods are producing substantially the same concentration measurements.
O The points fall very close to a quadratic line with x-intercepts of approximately 0 and 225. This suggests that the two methods are producing substantially different concentration measurements.
O The points fall very close to a straight line with an y-intercept of approximately 225 and a slope of about -1. This suggests that the two methods are producing substantially the same concentration measurements.
O The points fall very close to a straight line with an y-intercept of approximately 125 and a slope of about 0. This suggests that the two methods are producing substantially the same concentration measurements.
Expert Solution
This question has been solved!
Explore an expertly crafted, step-by-step solution for a thorough understanding of key concepts.

This is a popular solution!

Trending now
This is a popular solution!

Step by step
Solved in 2 steps with 1 images

Recommended textbooks for you
Functions and Change: A Modeling Approach to Coll…
Algebra
ISBN:
9781337111348
Author:
Bruce Crauder, Benny Evans, Alan Noell
Publisher:
Cengage Learning

Glencoe Algebra 1, Student Edition, 9780079039897…
Algebra
ISBN:
9780079039897
Author:
Carter
Publisher:
McGraw Hill
Functions and Change: A Modeling Approach to Coll…
Algebra
ISBN:
9781337111348
Author:
Bruce Crauder, Benny Evans, Alan Noell
Publisher:
Cengage Learning
Glencoe Algebra 1, Student Edition, 9780079039897…
Algebra
ISBN:
9780079039897
Author:
Carter
Publisher:
McGraw Hill