The electric power consumed each month by a chemical plant is thought to be related to the average ambient temperature x1, the number of days in the month x2, the average product purity x3. and the tons of product produced x4. The past year's historical data are available and are presented in the following table. y 240 236 290 274 414 301 316 300 000 296 267 276 288 261 x₁ 25 31 45 D₂ 24 21 24 25 O 25 20 I3 91 90 88 87 91 24 94 60 65 70 72 16 80 84 75 88 60 25 91 50 25 90 38 23 89 26 20 25 25 24 87 00 86 X4 100 95 110 88 94 2 99 OR 97 00 96 110 105 100 98 Predict power consumption for a month in which x₁ =75°F. x₂ =24 days, x3 =90%, andx4 = 98 tons. Use 1 decimal place.
The electric power consumed each month by a chemical plant is thought to be related to the average ambient temperature x1, the number of days in the month x2, the average product purity x3. and the tons of product produced x4. The past year's historical data are available and are presented in the following table. y 240 236 290 274 414 301 316 300 000 296 267 276 288 261 x₁ 25 31 45 D₂ 24 21 24 25 O 25 20 I3 91 90 88 87 91 24 94 60 65 70 72 16 80 84 75 88 60 25 91 50 25 90 38 23 89 26 20 25 25 24 87 00 86 X4 100 95 110 88 94 2 99 OR 97 00 96 110 105 100 98 Predict power consumption for a month in which x₁ =75°F. x₂ =24 days, x3 =90%, andx4 = 98 tons. Use 1 decimal place.

Functions and Change: A Modeling Approach to College Algebra (MindTap Course List)
6th Edition
ISBN:9781337111348
Author:Bruce Crauder, Benny Evans, Alan Noell
Publisher:Bruce Crauder, Benny Evans, Alan Noell
Chapter5: A Survey Of Other Common Functions
Section5.3: Modeling Data With Power Functions
Problem 6E: Urban Travel Times Population of cities and driving times are related, as shown in the accompanying...

Related questions
Question
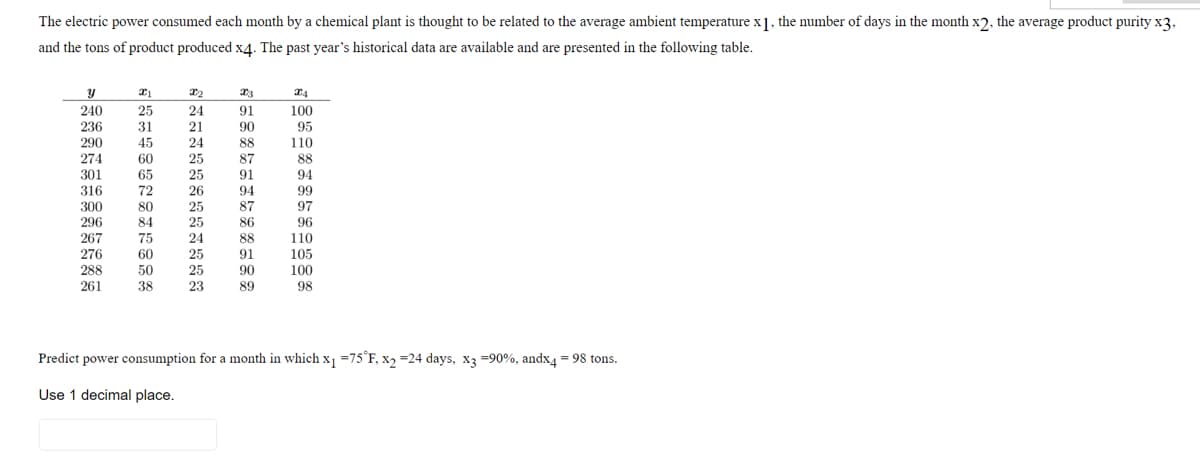
Transcribed Image Text:The electric power consumed each month by a chemical plant is thought to be related to the average ambient temperature x1, the number of days in the month x2, the average product purity x3,
and the tons of product produced x4. The past year's historical data are available and are presented in the following table.
y
240
236
290
274
214
301
316
910
300
300
296
x1
25
31
45
60
00
65
99
72
14
X₂
24
21
24
25
20
25
20
26
20
25
20
80
90
84
267
75
276
60
288
50
261 38 23
25
24
24
25
25
X3
91
90
88
00
87
91
94
2
87
DA
86
20
88
91
90
89
X₁
100
95
110
88
94
99
97
96
110
105
100
98
Predict power consumption for a month in which x₁ =75°F, x₂ =24 days, x3 =90%, andx4 = 98 tons.
Use 1 decimal place.
Expert Solution
This question has been solved!
Explore an expertly crafted, step-by-step solution for a thorough understanding of key concepts.

Step by step
Solved in 4 steps with 5 images

Recommended textbooks for you
Functions and Change: A Modeling Approach to Coll…
Algebra
ISBN:
9781337111348
Author:
Bruce Crauder, Benny Evans, Alan Noell
Publisher:
Cengage Learning

Linear Algebra: A Modern Introduction
Algebra
ISBN:
9781285463247
Author:
David Poole
Publisher:
Cengage Learning
Functions and Change: A Modeling Approach to Coll…
Algebra
ISBN:
9781337111348
Author:
Bruce Crauder, Benny Evans, Alan Noell
Publisher:
Cengage Learning
Linear Algebra: A Modern Introduction
Algebra
ISBN:
9781285463247
Author:
David Poole
Publisher:
Cengage Learning