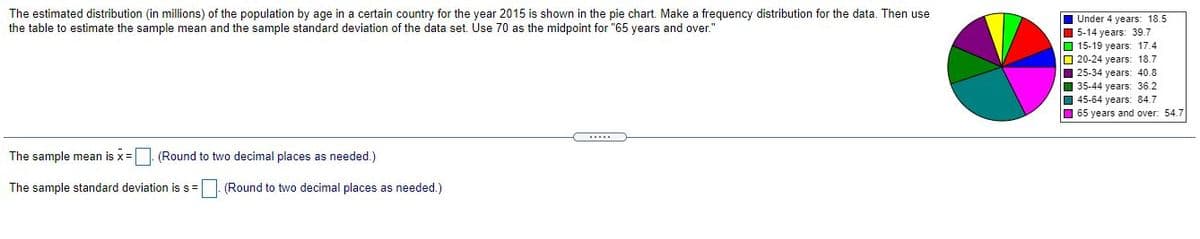
The estimated distribution (in millions) of the population by age in a certain country for the year 2015 is shown in the pie chart. Make a frequency distribution for the data. Then use the table to estimate the sample mean and the sample standard deviation of the data set. Úse 70 as the midpoint for "65 years and over." I Under 4 years: 18.5 I 5-14 years: 39.7 O 15-19 years: 17.4 O 20-24 years: 18.7 I 25-34 years: 40.8 I 35-44 years: 36.2 O 45-64 years: 84.7 O 65 years and over. 54.7 The sample mean is x= (Round to two decimal places as needed. ) The sample standard deviation is s = (Round to two decimal places as needed.)
The estimated distribution (in millions) of the population by age in a certain country for the year 2015 is shown in the pie chart. Make a frequency distribution for the data. Then use the table to estimate the sample mean and the sample standard deviation of the data set. Úse 70 as the midpoint for "65 years and over." I Under 4 years: 18.5 I 5-14 years: 39.7 O 15-19 years: 17.4 O 20-24 years: 18.7 I 25-34 years: 40.8 I 35-44 years: 36.2 O 45-64 years: 84.7 O 65 years and over. 54.7 The sample mean is x= (Round to two decimal places as needed. ) The sample standard deviation is s = (Round to two decimal places as needed.)

Glencoe Algebra 1, Student Edition, 9780079039897, 0079039898, 2018
18th Edition
ISBN:9780079039897
Author:Carter
Publisher:Carter
Chapter10: Statistics
Section10.4: Distributions Of Data
Problem 19PFA

Related questions
Question
Transcribed Image Text:The estimated distribution (in millions) of the population by age in a certain country for the year 2015 is shown in the pie chart. Make a frequency distribution for the data. Then use
the table to estimate the sample mean and the sample standard deviation of the data set. Use 70 as the midpoint for "65 years and over."
I Under 4 years: 18.5
I 5-14 years: 39.7
O 15-19 years: 17.4
O 20-24 years: 18.7
I 25-34 years: 40.8
I 35-44 years: 36.2
I 45-64 years: 84.7
I 65 years and over: 54.7
The sample mean is x=. (Round to two decimal places as needed.)
The sample standard deviation is s =
(Round to two decimal places as needed.)
Expert Solution
This question has been solved!
Explore an expertly crafted, step-by-step solution for a thorough understanding of key concepts.

This is a popular solution!

Trending now
This is a popular solution!

Step by step
Solved in 3 steps with 3 images

Recommended textbooks for you
Glencoe Algebra 1, Student Edition, 9780079039897…
Algebra
ISBN:
9780079039897
Author:
Carter
Publisher:
McGraw Hill
Glencoe Algebra 1, Student Edition, 9780079039897…
Algebra
ISBN:
9780079039897
Author:
Carter
Publisher:
McGraw Hill