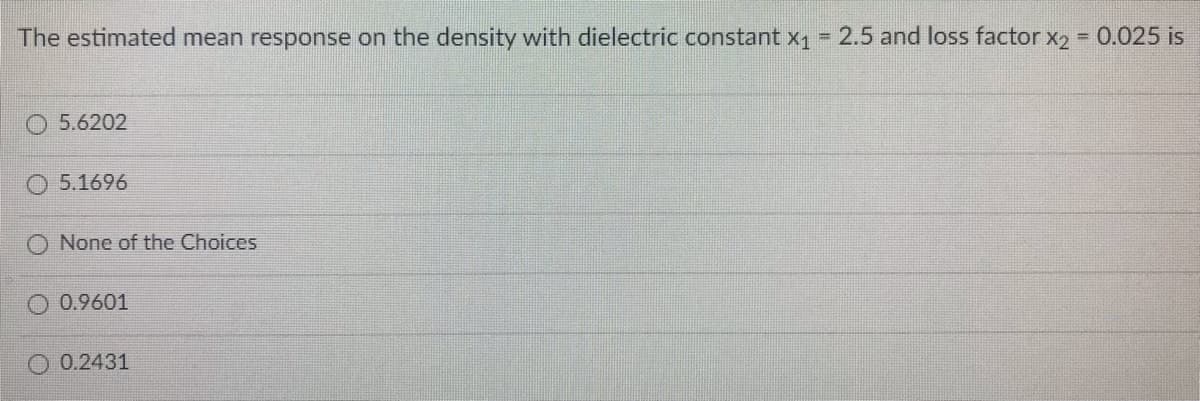
The estimated mean response on the density with dielectric constant x1 2.5 and loss factor x2 0.025 is !! !!


Q: Assume the proportion of the time within a year, Y, and any flood by Kucuk Menderes River is…
A: Given: Y is the proportion of time within a year. fy=51-y4 0<y<10…
Q: The radius and height of a right circular cone are measured with errors of at most 1% and 4%,…
A:
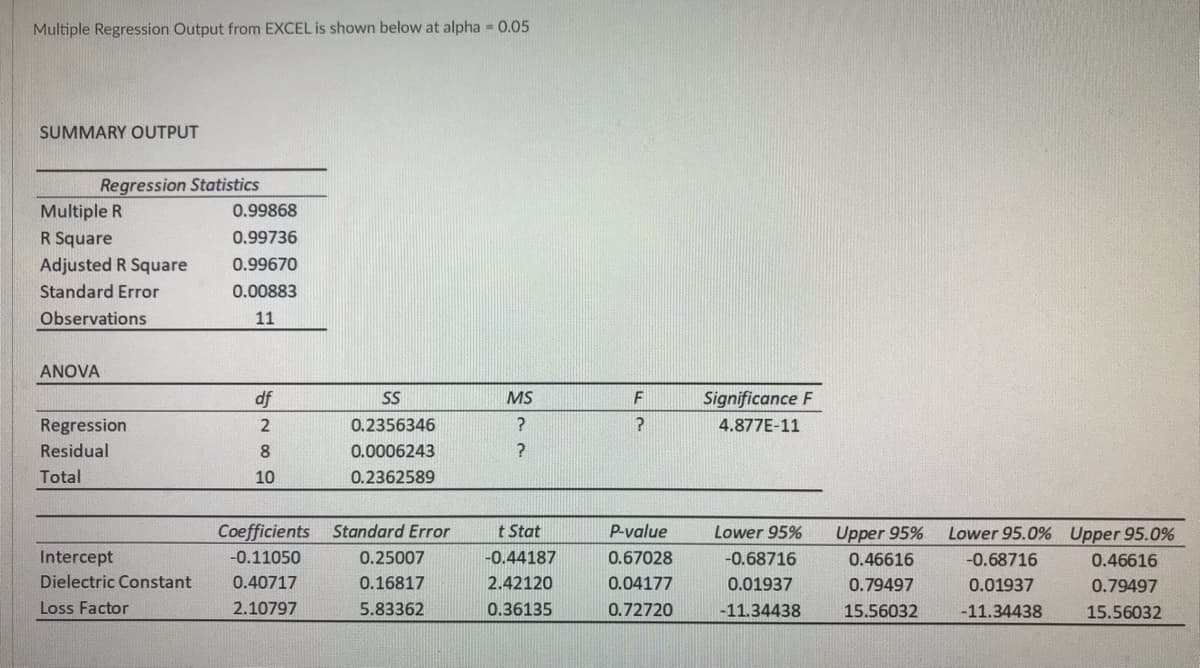
Q: The estimated mean response on the density with dielectric constant x1 = 2.5 and loss factor x2 =…
A: Given: Coefficient of intercept=-0.11050 Dielectric constant ( x1 ) =0.40717 Loss factor (…
Q: Find the average value of f(x) = sin³ x cos³x on the interval [0,1].
A: We need to find average value.
Q: Let Y1,..,Yn denote a random sample from the density function given by fy (yl0) = 1 -010, tor 0 > 0,…
A: Given: The given function fY(y|θ) = 1θryr-1 e-yrθ , for θ > 0, y > 0.
Q: The proportion of impurities per batch in a chemical product is a random variable X with density…
A:
Q: 18) Use two compositions of composite Simpson's method to estimate the integral Inx dx
A: The Simpson's rule can be used to calculate the integral approximation. The formula used in…
Q: Illustrate the setting up limits of a double integral?
A:
Q: Find the average rate of change of h(x) = cotx over the interval E, %3D
A:
Q: The inter-arrival time X between faults in a network is exponential with parameter = 5. Hence, X has…
A: From the given information, Consider, X be the inter-arrival time between faults in a network which…
Q: Find the generol solution of the differential eguotion given below,
A:
Q: uestion 6) Compute the average value of the function flx) = (6x2+5X +9.4) e on the interval L-5,6
A: Average value of function fx over interval a,bis given byAverage=1b-a∫abfx dx
Q: y1, y2,.., y10 be a random sample from an exponential pdf with unknown parameter A. Find the form of…
A:
Q: How to compute for the differential volume of each coordinate system and its phase area?
A: Hints: We have to discuss that how to compute for the differential volume of each coordinate system…
Q: I was calculating a conditional density function and I got an answer of 2x+3y all over 2x+3/2. When…
A: Introduction: The conditional density of X given Y is the joint density, f (x, y), divided by the…
Q: Please answer part c, d, and e ONLY. (Last 3 parts)
A:
Q: Find the average value of the function f (x) = 1 on the interval [0, 2]. Leave your x+1 answer in…
A: Use the formula for the average value of a function.
Q: Estimate the minimum number of subintervals needed to approximate the integral dx with an error of…
A: Consider the provided question, Hello. Since your question has multiple parts, we will solve first…
Q: Find the average rate of change of y with respect to x on the interval [1,4] where y=x^2+x+1
A:
Q: A college professor never finishes his lecture before the end of the hour and always finishes his…
A: Solution: Note: Hello! As you have posted more than 3 sub parts, we are answering the first 3…
Q: What is the average value of the function (arctan x)^2/1+x^2 over [1,square root 3]?
A:
Q: The area under the curve is negative, if z value is also negative. True or False?
A:
Q: (a) Is first order stationary (b) Has total average power of 61 W
A:
Q: Find the mass of the one-dimensional object. A wire that is 4 ft long (starting at x =0) and has a…
A:
Q: sketch the described regions of integration. 1 ≤x ≤ e2, 0≤ y ≤ ln x
A: Given 1 ≤x ≤e2 , 0≤ y ≤ ln x
Q: Find the average value of ƒ(x) = e2x on [0, ln 2].
A: Given ƒ(x) = e2x . We need to find the average value of a function in the interval [0,ln2].
Q: 3 +h (2x) dx By specifying the type of integr rol, examine it by its convegene explaining
A: We are given an improper integral of the first kind by the following.…
Q: Let y1, y2,.., y10 be a random sample from an exponential pdf with unknown parameter A. Find the…
A: Given: y1,y2,......,y10 is a random sample from an exponential pdf with unknown parameter λ. It is…
Q: Find the mean and variance of the gamma distribution using integration to obtain E(X) and E(X2).…
A: Gamma function is defined as: γα=∫0∞xa-1e-xdx Divide both sides by γα…
Q: Suppose that X is a continuous unknown with -2 < S2 with PDF denoted f satisfying $ (2) = c (4 –…
A: i) we know that the total probability should be one means the area under the PDF should be one.…
Q: Verify that the above is a valid density function. A batch is considered not sellable and then not…
A: It is given that Y : proportion or percentage of impurities in a batch.
Q: (b) Use differentials to estimate the maximum error in the calculated volume. What is the relative…
A:
Q: 4 Set upinbegrl for th volume caboud x- -I y. 12 and
A: Volume problem.....
Q: Which of f (x) = x sin2 x and g(x) = x2 sin2 x has a larger average value over [0, 1]? Over [1, 2]?
A:
Q: 1. The edge of a cube was found to be 32 cm with a possible error in measurement of 0.1 cm. Use…
A: Given : Measurement of edge of cube a = 32 cm Possible error in measurement of edge is da = 0.1 cm…
Q: Evaluate dx using Simpson's rule. 3
A:
Q: Compute the average value at the function H(x)=D (6x²+ x + 28) e on the interal [-4,6]
A:
Q: The area under the density curve that lies to the right of 15 is 0.324. What percentage of all…
A:
Q: The edge of a cube was found to be 15 cm with a possible error in measurement of 0.2 cm. Use…
A: The given data is: Edge of the cube x=15 cmPossible error dx=0.2 cm
Q: The edge of a cube was found to be 30 cm with a possibleerror in measurement of 0.1 cm. Use…
A: Let the length of the edge of a cube be x. Given data:
Q: Find the average value of y = √ax over [0, a]
A: We have to find average value of function: y=ax in the interval 0, a. We know the average value of…
Q: A right circular cylinder was measured and the dimensions were found to be r = 15 cm and h = 7 cm.…
A: Use the values of r, h to calculate the volume, V . Use the values of r , h, dr, dh to calculate the…
Q: Suppose that an automobile dealer pays an amount X (in thousands) for a used car and then sells it…
A:
Q: sketch the described regions of integration. -1 ≤ x ≤2, x - 1≤ y ≤ x2
A:
Q: Find the center of the mass of a thin plate of constant density ô covering the region 3 bounded by…
A:
Q: Find the average value of the function on the giveninterval. f(x) = Sin4x , [-π ,π]
A: Given- fx=sin4x To find- The average value of the function on the interval -π,π. Concept Used- The…
Q: a. Verify that ∫ ln x dx = x ln x - x + C. b. Find the average value of ln x over [1, e] .
A: (a) Given expression: ∫lnxdx=xlnx-x+C
Q: 4 * on the Find the average value of the function f(x) = 3x interval 2 < x < 6
A:
Q: A college professor never finishes his lecture before the end of the hour and always finishes his…
A: Probability Density Function: A continuous function f(x) is said to be the probability density…
Q: Find the mass of the thin bar with the given density function. {.. 3 if 0Sxs3 P(x) = 3+x if 3<xs5
A: We have to find

Step by step
Solved in 2 steps

- Olympic Pole Vault The graph in Figure 7 indicates that in recent years the winning Olympic men’s pole vault height has fallen below the value predicted by the regression line in Example 2. This might have occurred because when the pole vault was a new event there was much room for improvement in vaulters’ performances, whereas now even the best training can produce only incremental advances. Let’s see whether concentrating on more recent results gives a better predictor of future records. (a) Use the data in Table 2 (page 176) to complete the table of winning pole vault heights shown in the margin. (Note that we are using x=0 to correspond to the year 1972, where this restricted data set begins.) (b) Find the regression line for the data in part ‚(a). (c) Plot the data and the regression line on the same axes. Does the regression line seem to provide a good model for the data? (d) What does the regression line predict as the winning pole vault height for the 2012 Olympics? Compare this predicted value to the actual 2012 winning height of 5.97 m, as described on page 177. Has this new regression line provided a better prediction than the line in Example 2?A Simple Linear Regression (SLR) was performed where the monthly Revenue ("Rev", the y-variable) was regressed on the monthly Advertising Expenditures ("Expend", the x-variable). The Excel-generated Regression output is provided below: ANOVA df SS MS F Significance F Regression 1 492.528125 492.528125 10.65525634 0.046980871 Residual 3 138.671875 46.22395833 Total 4 631.2 Coefficients Standard Error t Stat P-value Lower 95% Upper 95% Intercept 23.1328125 5.324310936 4.344752359 0.022510469 6.188478833 40.07714617 Expend 3.1015625 0.950164031 3.264239014 0.046980871 0.077716489 6.125408511 a. From the Excel-generated Regression output above, give the value of b0, the estimated y-intercept. Round off your answer to the fourth decimal place. b0 =____. b. From the Excel-generated Regression output above, give the value of b1 , the estimated slope. Round off your answer to the fourth decimal place. b1 = _________A Simple Linear Regression (SLR) was performed where the monthly Revenue ("Rev", the y-variable) was regressed on the monthly Advertising Expenditures ("Expend", the x-variable). The Excel-generated Regression output is provided below: ANOVA df SS MS F Significance F Regression 1 492.528125 492.528125 10.65525634 0.046980871 Residual 3 138.671875 46.22395833 Total 4 631.2 Coefficients Standard Error t Stat P-value Lower 95% Upper 95% Intercept 23.1328125 5.324310936 4.344752359 0.022510469 6.188478833 40.07714617 Expend 3.1015625 0.950164031 3.264239014 0.046980871 0.077716489 6.125408511 a. From the Excel-generated Regression output above, give the value of b subscript o, the estimated y-intercept. Round off your answer to the fourth decimal place. b subscript 0 = Blank 1. Fill in the blank, read surrounding text. b. From the Excel-generated Regression output above, give the value of b subscript 1, the estimated slope. Round off your answer to…
- The owner of a new pizzeria in town wants to study the relationship between weekly revenue and advertising expenditures. All measures are recorded in thousands of dollars. The summary output for the regression model is given below. ANOVA dfdf SSSS MSMS FF Significance FF Regression 1 19.52147562 19.52147562 19.03486740 0.002403282 Residual 8 8.204512367 1.02556405 Total 9 27.72598799 Step 2 of 3 : What is the adjusted coefficient of determination for this model, R2a? Round your answer to four decimal places.A part of the output of a regression analysis of Y against X using Excel is given below:SUMMARY OUTPUTRegression StatisticsMultiple R 0.954704R Square 0.91146Adjusted R Square 0.896703Standard Error 28.98954Observations 8ANOVAdf SS MS F Significance FRegression 1 51907.64 51907.64Residual 6 5042.361 840.3936Total 7 56950Coefficients Standard Error t Stat P-valueIntercept 45.2159 39.8049Age 5.3265 0.6777a. State the estimated regression line and interpret the slope coefficient.The following data is a regression model where the U.S. Department of Transportation has tried to relate the rate of fatal traffic accidents (per 1000 licenses) to the percentage of motorists under the age of 21. Data has been collected for 42 major cities in the United States. SUMMARY OUTPUT Regression Statistics Multiple R 0.83938748 R Square 0.70457134 Adjusted R Square 0.69718562 Standard Error 0.58935028 Observations 42 ANOVA df SS MS F Regression 1 33.13441764 33.1344 95.3964 Residual 40 13.89335048 0.34733 Total 41 47.02776812 Coefficients Standard Error t Stat P-value Intercept -1.5974138 0.371671454 -4.2979 0.00010 Percent Under 21 0.28705317 0.029389769 9.76711 3.79E-9…
- Consider the following computer output of a multiple regression analysis relating annual salary to years of education and years of work experience. Regression Statistics Multiple R 0.73720.7372 R Square 0.54340.5434 Adjusted R Square 0.52350.5235 Standard Error 2120.66062120.6606 Observations 4949 ANOVA dfdf SSSS MSMS F� Significance F� Regression 22 246,191,336.3605246,191,336.3605 123,095,668.1803123,095,668.1803 27.371627.3716 1.5E-081.5E-08 Residual 4646 206,871,255.7619206,871,255.7619 4,497,201.21224,497,201.2122 Total 4848 453,062,592.1224453,062,592.1224 Coefficients Standard Error t� Stat P-value Lower 95%95% Upper 95%95% Intercept 14262.1701214262.17012 2,508.63812,508.6381 5.68525.6852 0.0000008560.000000856 9212.54359212.5435 19,311.796719,311.7967 Education (Years) 2354.97312354.9731 335.4472335.4472 7.02047.0204 0.0000000080.000000008 1679.75291679.7529 3030.19333030.1933 Experience (Years) 830.0759830.0759…Consider the following computer output of a multiple regression analysis relating annual salary to years of education and years of work experience. Regression Statistics Multiple R 0.73720.7372 R Square 0.54340.5434 Adjusted R Square 0.52350.5235 Standard Error 2120.66062120.6606 Observations 4949 ANOVA dfdf SSSS MSMS F� Significance F� Regression 22 246,191,336.3605246,191,336.3605 123,095,668.1803123,095,668.1803 27.371627.3716 1.5E-081.5E-08 Residual 4646 206,871,255.7619206,871,255.7619 4,497,201.21224,497,201.2122 Total 4848 453,062,592.1224453,062,592.1224 Coefficients Standard Error t� Stat P-value Lower 95%95% Upper 95%95% Intercept 14262.1701214262.17012 2,508.63812,508.6381 5.68525.6852 0.0000008560.000000856 9212.54359212.5435 19,311.796719,311.7967 Education (Years) 2354.97312354.9731 335.4472335.4472 7.02047.0204 0.0000000080.000000008 1679.75291679.7529 3030.19333030.1933 Experience (Years) 830.0759830.0759…The owner of a new pizzeria in town wants to study the relationship between weekly revenue and advertising expenditures. All measures are recorded in thousands of dollars. The summary output for the regression model is given below.ANOVA dfdf SSSS MSMS F� Significance F� Regression 11 16.8975147616.89751476 16.8975147616.89751476 16.9480751816.94807518 0.0062385580.006238558 Residual 66 5.9821004755.982100475 0.997016750.99701675 Total 77 22.8796152422.87961524 Step 2 of 3 : What is the adjusted coefficient of determination for this model, R2a��2? Round your answer to four decimal places.
- A researcher notes that, in a certain region, a disproportionate number of software millionaires were born around the year 1955. Is this a coincidence, or does birth year matter when gauging whether a software founder will besuccessful? The researcher investigated this question by analyzing the data shown in the accompanying table. Complete parts a through c below. a. Find the coefficient of determination for the simple linear regression model relating number (y) of software millionaire birthdays in a decade to total number (x) of births in the region. Interpret the result. The coefficient of determination is 1.___? (Round to three decimal places as needed.) This value indicates that 2.____ of the sample variation in the number of software millionaire birthdays is explained by the linear relationship with the total number of births in the region. (Round to one decimal place as needed.) b. Find the coefficient of determination for the simple linear regression model…Here there is a skewness and kurtosis test for residuals of a linear regression analysis. Interpret the values and histogram of residuals to check whether there is normal distribution. kurtosis n NADeveloped 0.349937 448 64Developing 3.469676 2010 416 kurtosis n NADeveloped 0.349937 448 64Developing 3.469676 2010 416The authors of a paper were interested in how the distance a deer mouse will travel for food is related to the distance from the food to the nearest pile of debris. Distances were measured in meters. The data and computer output are given below. Distance from Debris Distance Traveled 6.94 0.00 5.23 6.13 5.21 11.29 7.10 14.35 8.16 12.03 5.50 22.72 9.19 20.11 9.05 26.16 9.36 30.65 Simple Linear Regression Results: Dependent Variable: Traveled Independent Variable: Debris Sample size: 9 R (correlation coefficient) = 0.5657 R-sq = 0.32002088 Estimate of error standard deviation 8.670711 Parameter estimates: Parameter Estimate Std. Err. Alternative DF T-Stat P-Value Intercept -7.6854587 13.332196 ≠ 0 7 -0.5764586 0.5824 Slope 3.2340908 1.7818117 ≠ 0 7 1.8150575 0.1124 a)What is the least squares regression line for the output given above? b) what is the predicted traveled distance given the distance from debris is 6.5 meters?
