The expected return on market portfolio is 8.50 per cent with a Standard deviation of 3. The RF is 5 per cent. Which portfolio has performed as the best?
The expected return on market portfolio is 8.50 per cent with a Standard deviation of 3. The RF is 5 per cent. Which portfolio has performed as the best?

Functions and Change: A Modeling Approach to College Algebra (MindTap Course List)
6th Edition
ISBN:9781337111348
Author:Bruce Crauder, Benny Evans, Alan Noell
Publisher:Bruce Crauder, Benny Evans, Alan Noell
Chapter5: A Survey Of Other Common Functions
Section5.3: Modeling Data With Power Functions
Problem 6E: Urban Travel Times Population of cities and driving times are related, as shown in the accompanying...

Related questions
Question
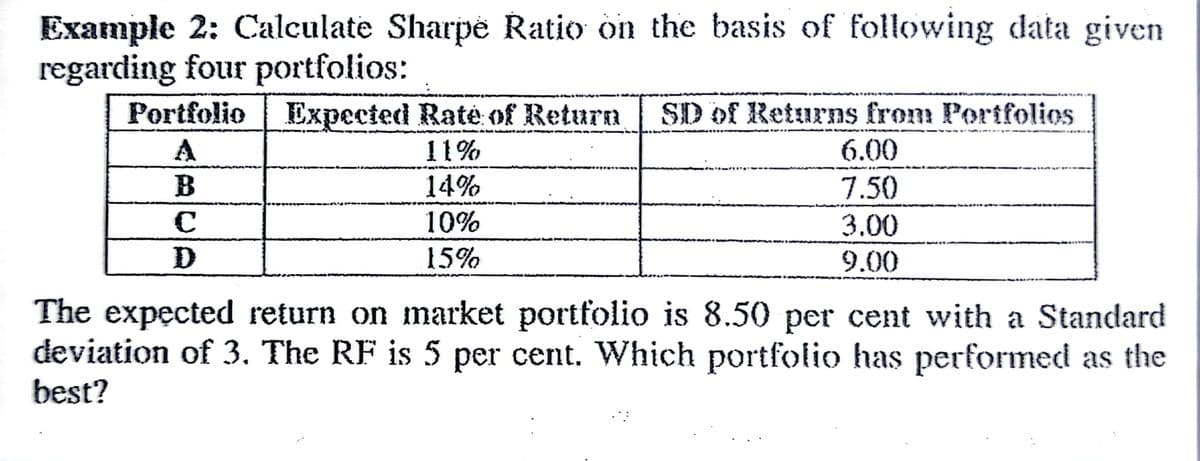
Transcribed Image Text:Example 2: Calculate Sharpë Ratio on the basis of following data given
regarding four portfolios:
Portfolio Expected Rate of Return
SD of Returns from Portfolios
A
11%
6.00
14%
7.50
10%
3.00
9.00
15%
The expected return on market portfolio is 8.50 per cent with a Standard
deviation of 3. The RF is 5 per cent. Which portfolio has performed as the
best?
Expert Solution
This question has been solved!
Explore an expertly crafted, step-by-step solution for a thorough understanding of key concepts.

Step by step
Solved in 2 steps with 1 images

Recommended textbooks for you
Functions and Change: A Modeling Approach to Coll…
Algebra
ISBN:
9781337111348
Author:
Bruce Crauder, Benny Evans, Alan Noell
Publisher:
Cengage Learning

Glencoe Algebra 1, Student Edition, 9780079039897…
Algebra
ISBN:
9780079039897
Author:
Carter
Publisher:
McGraw Hill
Functions and Change: A Modeling Approach to Coll…
Algebra
ISBN:
9781337111348
Author:
Bruce Crauder, Benny Evans, Alan Noell
Publisher:
Cengage Learning
Glencoe Algebra 1, Student Edition, 9780079039897…
Algebra
ISBN:
9780079039897
Author:
Carter
Publisher:
McGraw Hill