The expected value of R4 is

Glencoe Algebra 1, Student Edition, 9780079039897, 0079039898, 2018
18th Edition
ISBN:9780079039897
Author:Carter
Publisher:Carter
Chapter10: Statistics
Section10.5: Comparing Sets Of Data
Problem 14PPS

Related questions
Question
q16
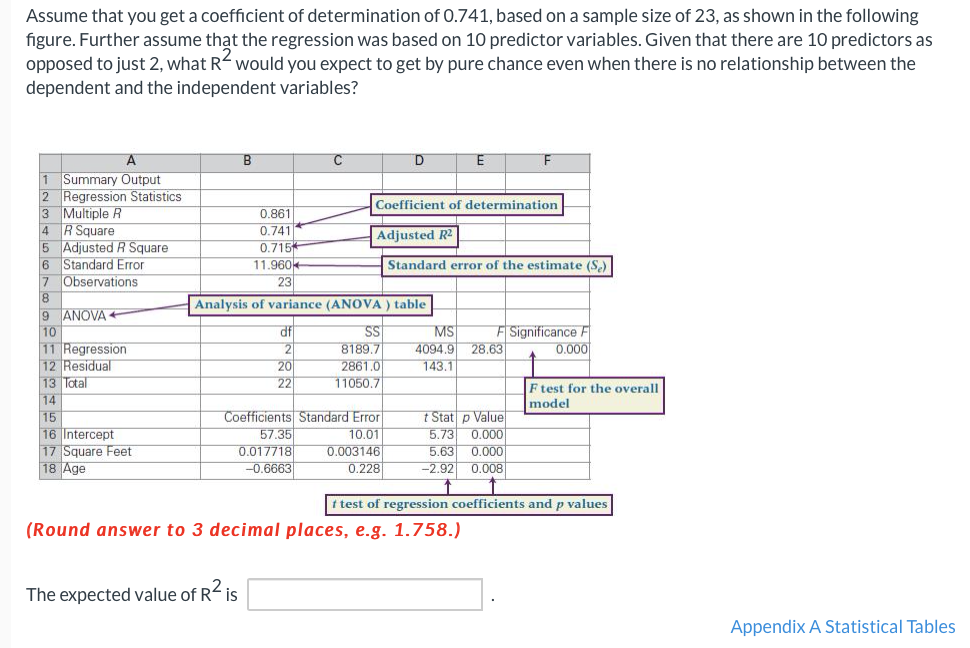
Transcribed Image Text:Assume that you get a coefficient of determination of 0.741, based on a sample size of 23, as shown in the following
figure. Further assume that the regression was based on 10 predictor variables. Given that there are 10 predictors as
opposed to just 2, what R- would you expect to get by pure chance even when there is no relationship between the
dependent and the independent variables?
C
1 Summary Output
2 Regression Statistics
3 Multiple R
R Square
5 Adjusted R Square
6 Standard Error
7 Observations
8
Coefficient of determination
0.861
4
0.741
Adjusted R2
0.715
11.960
23
Analysis of variance (ANOVA ) table
Standard error of the estimate (S.)
9 ANOVA +
10
11 Regression
12 Residual
13 Total
14
df
21
20
22
SS
8189.7
2861.0
MS
F Significance F
28.63
4094.9
143.1
0.000
11050,7
F test for the overall
model
t Stat p Value
5.73 0.000
5.63 0.000
-2.92 0.008
15
Coefficients Standard Error
16 Intercept
17 Square Feet
18 Age
57.35
0.017718
-0.6663
10.01
0.003146
0.228
t test of regression coefficients and p values
(Round answer to 3 decimal places, e.g. 1.758.)
The expected value of R is
Appendix A Statistical Tables
Expert Solution
This question has been solved!
Explore an expertly crafted, step-by-step solution for a thorough understanding of key concepts.

Step by step
Solved in 2 steps with 1 images

Recommended textbooks for you
Glencoe Algebra 1, Student Edition, 9780079039897…
Algebra
ISBN:
9780079039897
Author:
Carter
Publisher:
McGraw Hill
Glencoe Algebra 1, Student Edition, 9780079039897…
Algebra
ISBN:
9780079039897
Author:
Carter
Publisher:
McGraw Hill