The F ratio used to test for the existence of' a linear relationship between the dependent variable and any independent variable is: O None of the Choices O MSE/MSR O MSR/MSE O MSR/MST O MSE/(n-(k + 1))
The F ratio used to test for the existence of' a linear relationship between the dependent variable and any independent variable is: O None of the Choices O MSE/MSR O MSR/MSE O MSR/MST O MSE/(n-(k + 1))

Algebra & Trigonometry with Analytic Geometry
13th Edition
ISBN:9781133382119
Author:Swokowski
Publisher:Swokowski
Chapter3: Functions And Graphs
Section3.2: Graphs Of Equations
Problem 78E

Related questions
Question
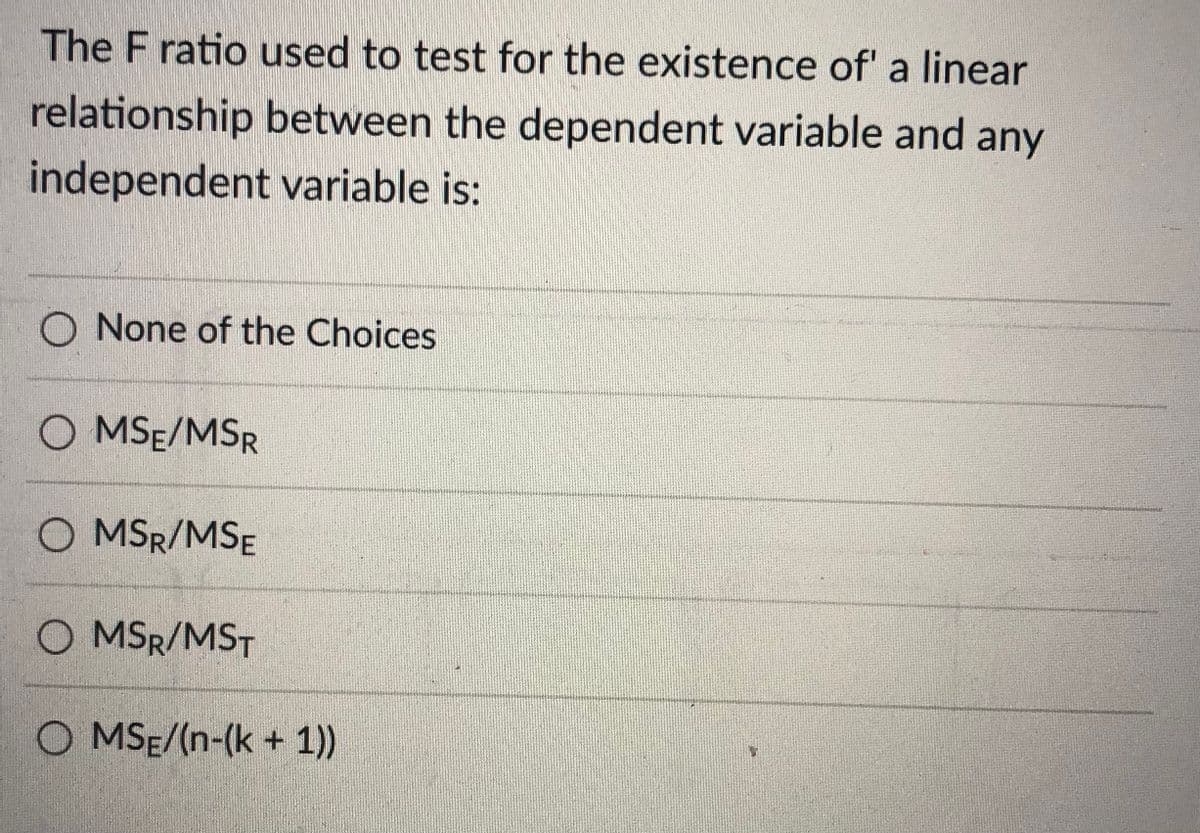
Transcribed Image Text:The F ratio used to test for the existence of' a linear
relationship between the dependent variable and any
independent variable is:
O None of the Choices
O MSE/MSR
O MSR/MSE
O MSR/MST
O MSE/(n-(k + 1))
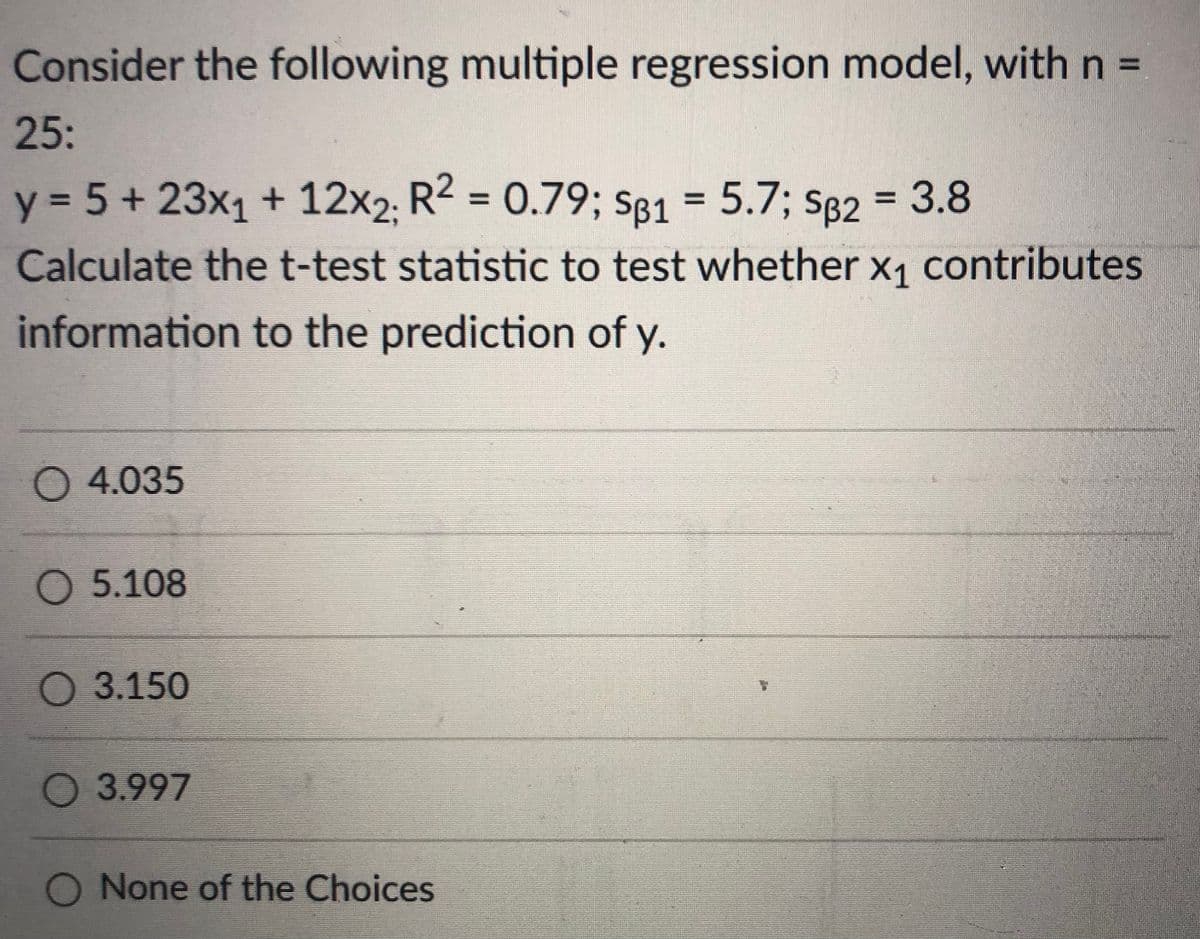
Transcribed Image Text:Consider the following multiple regression model, with n =
25:
y = 5+ 23x1 + 12x2. R2 = 0.79; S81 = 5.7; S82 = 3.8
%3D
%3D
Calculate thet-test statistic to test whether x1 contributes
information to the prediction of y.
O 4.035
О 5.108
3.150
О 3.997
O None of the Choices
Expert Solution
This question has been solved!
Explore an expertly crafted, step-by-step solution for a thorough understanding of key concepts.

This is a popular solution!

Trending now
This is a popular solution!

Step by step
Solved in 2 steps with 2 images

Recommended textbooks for you
Algebra & Trigonometry with Analytic Geometry
Algebra
ISBN:
9781133382119
Author:
Swokowski
Publisher:
Cengage
Algebra & Trigonometry with Analytic Geometry
Algebra
ISBN:
9781133382119
Author:
Swokowski
Publisher:
Cengage