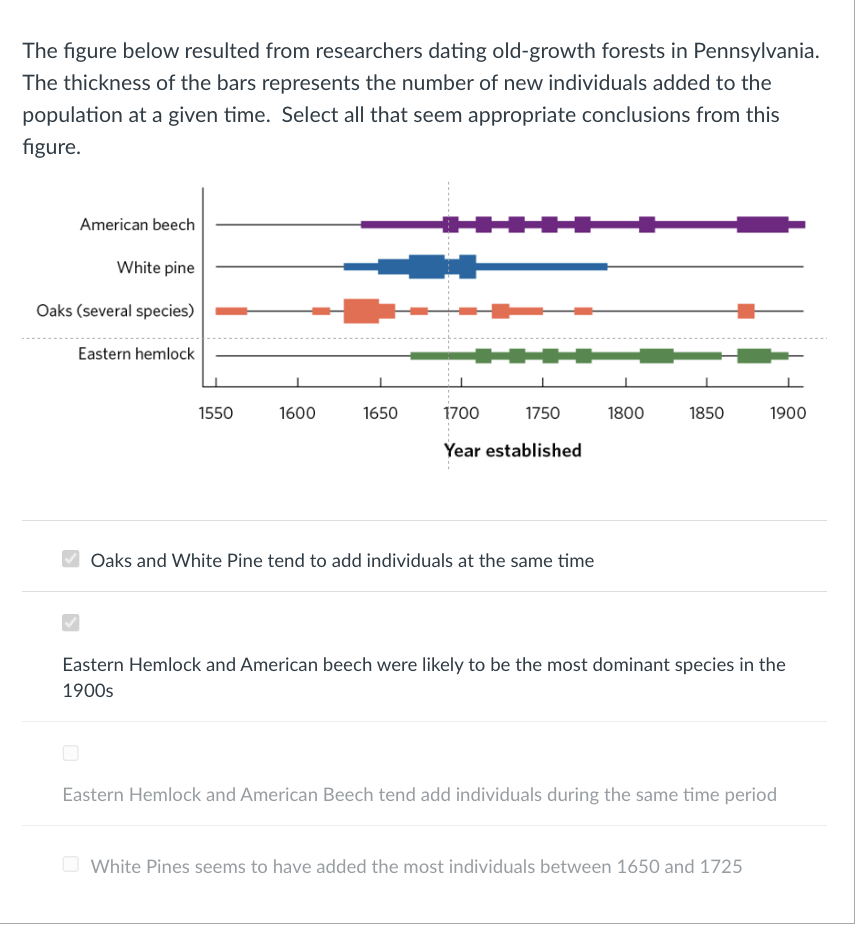
The figure below resulted from researchers dating old-growth forests in Pennsylvania. The thickness of the bars represents the number of new individuals added to the population at a given time. Select all that seem appropriate conclusions from this figure. American beech White pine Oaks (several species) Eastern hemlock 1550 1600 1650 1700 1750 Year established Oaks and White Pine tend to add individuals at the same time 1800 1850 1900 Eastern Hemlock and American beech were likely to be the most dominant species in the 1900s Eastern Hemlock and American Beech tend add individuals during the same time period White Pines seems to have added the most individuals between 1650 and 1725
The figure below resulted from researchers dating old-growth forests in Pennsylvania. The thickness of the bars represents the number of new individuals added to the population at a given time. Select all that seem appropriate conclusions from this figure. American beech White pine Oaks (several species) Eastern hemlock 1550 1600 1650 1700 1750 Year established Oaks and White Pine tend to add individuals at the same time 1800 1850 1900 Eastern Hemlock and American beech were likely to be the most dominant species in the 1900s Eastern Hemlock and American Beech tend add individuals during the same time period White Pines seems to have added the most individuals between 1650 and 1725

Science Of Agriculture Biological Approach
5th Edition
ISBN:9780357229323
Author:Herren
Publisher:Herren
Chapter19: Wildlife Management
Section: Chapter Questions
Problem 1SLA

Related questions

Question
Transcribed Image Text:The figure below resulted from researchers dating old-growth forests in Pennsylvania.
The thickness of the bars represents the number of new individuals added to the
population at a given time. Select all that seem appropriate conclusions from this
figure.
American beech
White pine
Oaks (several species)
Eastern hemlock
1550
1600
1650
1700
1750
Year established
Oaks and White Pine tend to add individuals at the same time
1800
1850
1900
Eastern Hemlock and American beech were likely to be the most dominant species in the
1900s
Eastern Hemlock and American Beech tend add individuals during the same time period
White Pines seems to have added the most individuals between 1650 and 1725
Expert Solution
This question has been solved!
Explore an expertly crafted, step-by-step solution for a thorough understanding of key concepts.

Step by step
Solved in 3 steps

Knowledge Booster


Learn more about
Need a deep-dive on the concept behind this application? Look no further. Learn more about this topic, biology and related others by exploring similar questions and additional content below.Recommended textbooks for you