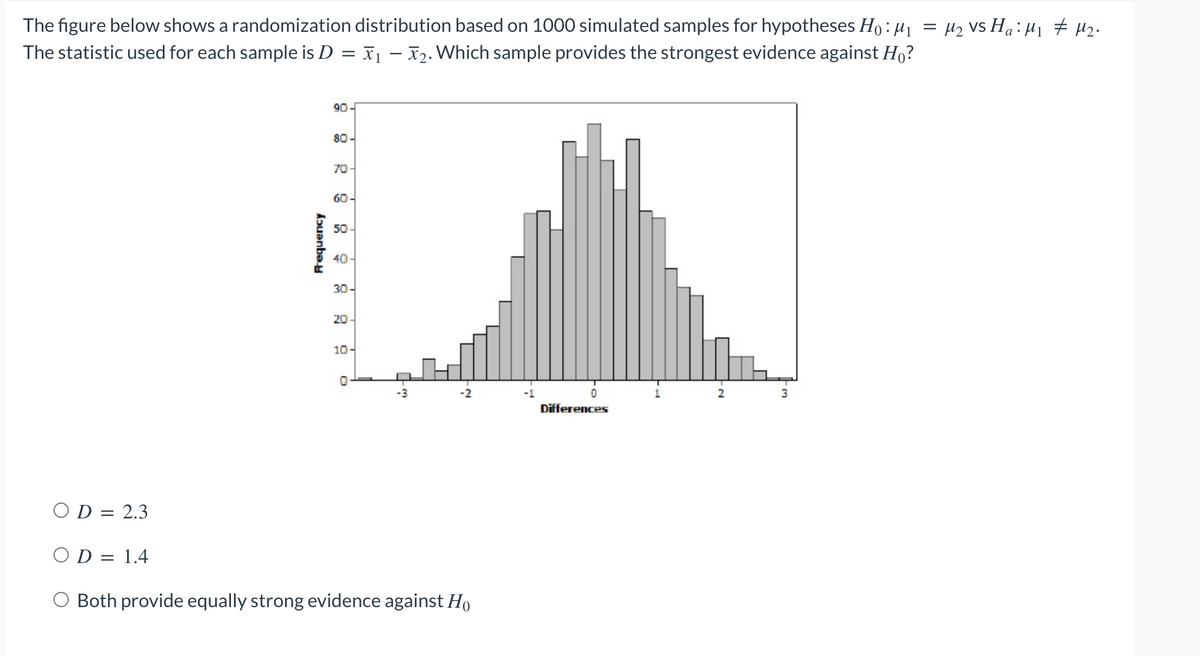
The figure below shows a randomization distribution based on 1000 simulated samples for hypotheses Ho:μ₁ = µ₂ VS H₁: M₁ M₂. The statistic used for each sample is D = ₁-₂. Which sample provides the strongest evidence against Ho? OD= 2.3 Aanbe 90- 80- 70 60 50 40 30- 20 10- 0 OD = 1.4 O Both provide equally strong evidence against Ho 0 Differences 1 2
The figure below shows a randomization distribution based on 1000 simulated samples for hypotheses Ho:μ₁ = µ₂ VS H₁: M₁ M₂. The statistic used for each sample is D = ₁-₂. Which sample provides the strongest evidence against Ho? OD= 2.3 Aanbe 90- 80- 70 60 50 40 30- 20 10- 0 OD = 1.4 O Both provide equally strong evidence against Ho 0 Differences 1 2
Holt Mcdougal Larson Pre-algebra: Student Edition 2012
1st Edition
ISBN:9780547587776
Author:HOLT MCDOUGAL
Publisher:HOLT MCDOUGAL
Chapter11: Data Analysis And Probability
Section: Chapter Questions
Problem 8CR
Related questions
Question

Transcribed Image Text:The figure below shows a randomization distribution based on 1000 simulated samples for hypotheses Ho: μ₁1
The statistic used for each sample is D = ₁ - ₂. Which sample provides the strongest evidence against Ho?
OD = 2.3
OD = 1.4
Frequency
90
80-
70
60
50
40
30
20
10-
0
F
2
Both provide equally strong evidence against Ho
-1
0
Differences
2
=
M₂ Vs Ha: M₁ M₂.
Expert Solution
This question has been solved!
Explore an expertly crafted, step-by-step solution for a thorough understanding of key concepts.
This is a popular solution!
Trending now
This is a popular solution!
Step by step
Solved in 2 steps with 2 images

Recommended textbooks for you

Holt Mcdougal Larson Pre-algebra: Student Edition…
Algebra
ISBN:
9780547587776
Author:
HOLT MCDOUGAL
Publisher:
HOLT MCDOUGAL

Algebra & Trigonometry with Analytic Geometry
Algebra
ISBN:
9781133382119
Author:
Swokowski
Publisher:
Cengage

Holt Mcdougal Larson Pre-algebra: Student Edition…
Algebra
ISBN:
9780547587776
Author:
HOLT MCDOUGAL
Publisher:
HOLT MCDOUGAL

Algebra & Trigonometry with Analytic Geometry
Algebra
ISBN:
9781133382119
Author:
Swokowski
Publisher:
Cengage