The figure below shows the graph of a linear function, f(x), whose limit at an unspecified x-coordinate evaluates to L (shown as a red point on the y-axis). A positive value for e has been chosen. Complete the following tasks: 1. Adjust the value of a by sliding the purple movable point to obtain the approximate x-coordinate at which the limit of the function evaluates to L. In other words, find the value of a such that limf(x) = L. Adjust the value of 8 by sliding the orange movable points to obtain an approximate interval of x such that if 0 < x-al < 8, then [f(x) - L| < e. Note that this assessment does not require you to obtain exact measures of a and 8 since the exact form of f(x) is not given. Instead, you will use the graph to approximate a and 8 in a way that agrees with your understanding of the formal epsilon-delta definition of the limit. Provide your answer below: -10 RESET -5 + 10 Z+e L 73 E 5 0 -5 -10 1 5 10
The figure below shows the graph of a linear function, f(x), whose limit at an unspecified x-coordinate evaluates to L (shown as a red point on the y-axis). A positive value for e has been chosen. Complete the following tasks: 1. Adjust the value of a by sliding the purple movable point to obtain the approximate x-coordinate at which the limit of the function evaluates to L. In other words, find the value of a such that limf(x) = L. Adjust the value of 8 by sliding the orange movable points to obtain an approximate interval of x such that if 0 < x-al < 8, then [f(x) - L| < e. Note that this assessment does not require you to obtain exact measures of a and 8 since the exact form of f(x) is not given. Instead, you will use the graph to approximate a and 8 in a way that agrees with your understanding of the formal epsilon-delta definition of the limit. Provide your answer below: -10 RESET -5 + 10 Z+e L 73 E 5 0 -5 -10 1 5 10

Functions and Change: A Modeling Approach to College Algebra (MindTap Course List)
6th Edition
ISBN:9781337111348
Author:Bruce Crauder, Benny Evans, Alan Noell
Publisher:Bruce Crauder, Benny Evans, Alan Noell
Chapter1: Functions
Section1.2: Functions Given By Tables
Problem 32SBE: Does a Limiting Value Occur? A rocket ship is flying away from Earth at a constant velocity, and it...

Related questions
Question
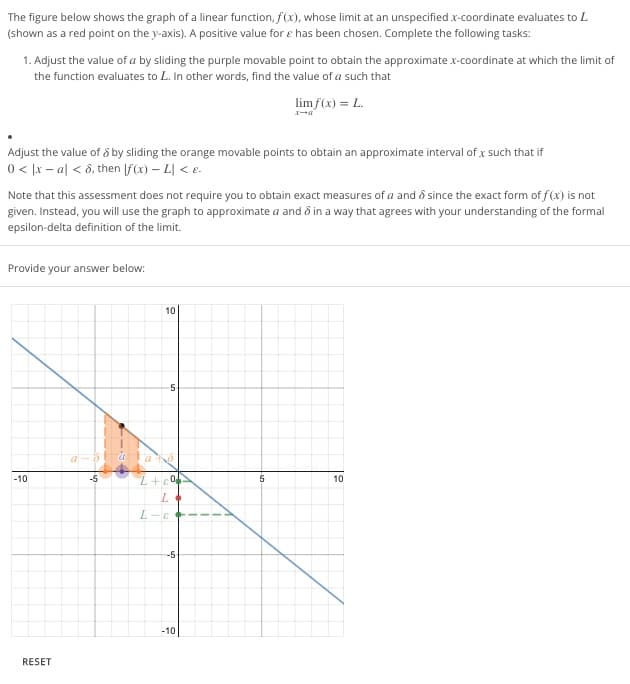
Transcribed Image Text:The figure below shows the graph of a linear function, f(x), whose limit at an unspecified .x-coordinate evaluates to L
(shown as a red point on the y-axis). A positive value for e has been chosen. Complete the following tasks:
1. Adjust the value of a by sliding the purple movable point to obtain the approximate x-coordinate at which the limit of
the function evaluates to L. In other words, find the value of a such that
limf(x) = L.
Adjust the value of 8 by sliding the orange movable points to obtain an approximate interval of .x such that if
0 < x-al < 8, then [f(x) - L| < e.
Note that this assessment does not require you to obtain exact measures of a and since the exact form of f(x) is not
given. Instead, you will use the graph to approximate a and 8 in a way that agrees with your understanding of the formal
epsilon-delta definition of the limit.
Provide your answer below:
-10
RESET
a-s
-5
+
10
L+e
L
L
E
5
0
-5
-10
1
5
10
Expert Solution
This question has been solved!
Explore an expertly crafted, step-by-step solution for a thorough understanding of key concepts.

Step by step
Solved in 4 steps with 4 images

Recommended textbooks for you
Functions and Change: A Modeling Approach to Coll…
Algebra
ISBN:
9781337111348
Author:
Bruce Crauder, Benny Evans, Alan Noell
Publisher:
Cengage Learning

College Algebra (MindTap Course List)
Algebra
ISBN:
9781305652231
Author:
R. David Gustafson, Jeff Hughes
Publisher:
Cengage Learning

Functions and Change: A Modeling Approach to Coll…
Algebra
ISBN:
9781337111348
Author:
Bruce Crauder, Benny Evans, Alan Noell
Publisher:
Cengage Learning
College Algebra (MindTap Course List)
Algebra
ISBN:
9781305652231
Author:
R. David Gustafson, Jeff Hughes
Publisher:
Cengage Learning