The figure below shows the graph of the curve with equation y = f(x). The curve meets the y axis at A(0, 7) and has a minimum point at B(2, 3). A(0,7) B(2,3) y = f(x) a) Write down the coordinates of the points A and B under the transformation y = f(x + 2). A = ( B = ( " ) )
The figure below shows the graph of the curve with equation y = f(x). The curve meets the y axis at A(0, 7) and has a minimum point at B(2, 3). A(0,7) B(2,3) y = f(x) a) Write down the coordinates of the points A and B under the transformation y = f(x + 2). A = ( B = ( " ) )

Algebra & Trigonometry with Analytic Geometry
13th Edition
ISBN:9781133382119
Author:Swokowski
Publisher:Swokowski
Chapter3: Functions And Graphs
Section3.3: Lines
Problem 26E

Related questions
Question
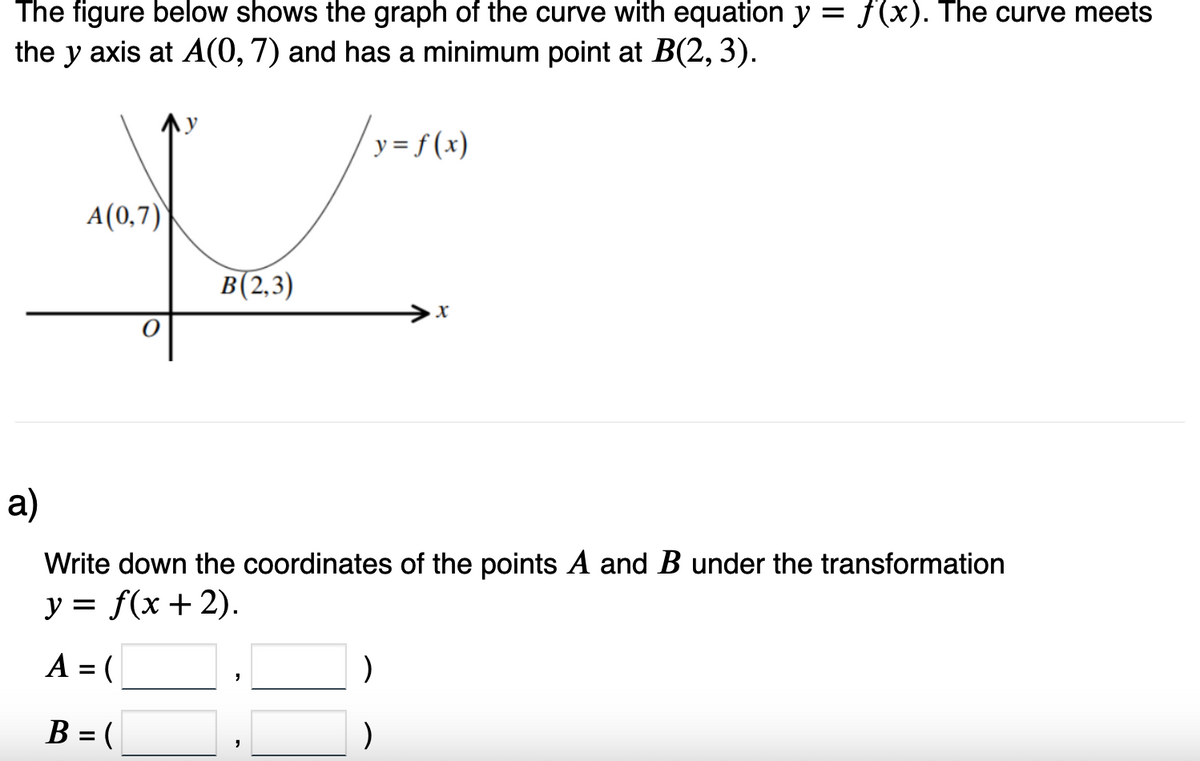
Transcribed Image Text:The figure below shows the graph of the curve with equation y = f(x). The curve meets
the y axis at A(0, 7) and has a minimum point at B(2, 3).
y = f(x)
A(0,7)
B(2,3)
X
a)
Write down the coordinates of the points A and B under the transformation
y = f(x + 2).
A = (
B = (
)
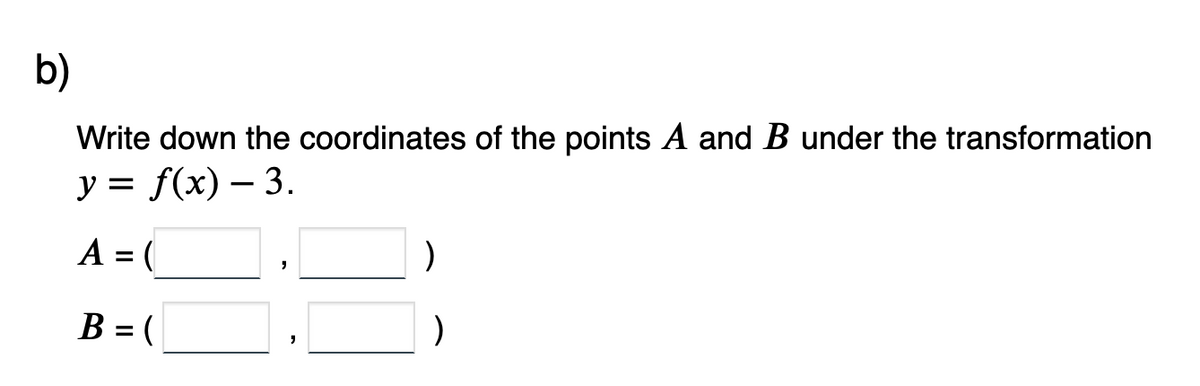
Transcribed Image Text:b)
Write down the coordinates of the points A and B under the transformation
y = f(x) - 3.
A = (
B = (
"
Expert Solution
This question has been solved!
Explore an expertly crafted, step-by-step solution for a thorough understanding of key concepts.

This is a popular solution!

Trending now
This is a popular solution!

Step by step
Solved in 5 steps with 8 images

Recommended textbooks for you
Algebra & Trigonometry with Analytic Geometry
Algebra
ISBN:
9781133382119
Author:
Swokowski
Publisher:
Cengage

Functions and Change: A Modeling Approach to Coll…
Algebra
ISBN:
9781337111348
Author:
Bruce Crauder, Benny Evans, Alan Noell
Publisher:
Cengage Learning
Algebra & Trigonometry with Analytic Geometry
Algebra
ISBN:
9781133382119
Author:
Swokowski
Publisher:
Cengage
Functions and Change: A Modeling Approach to Coll…
Algebra
ISBN:
9781337111348
Author:
Bruce Crauder, Benny Evans, Alan Noell
Publisher:
Cengage Learning