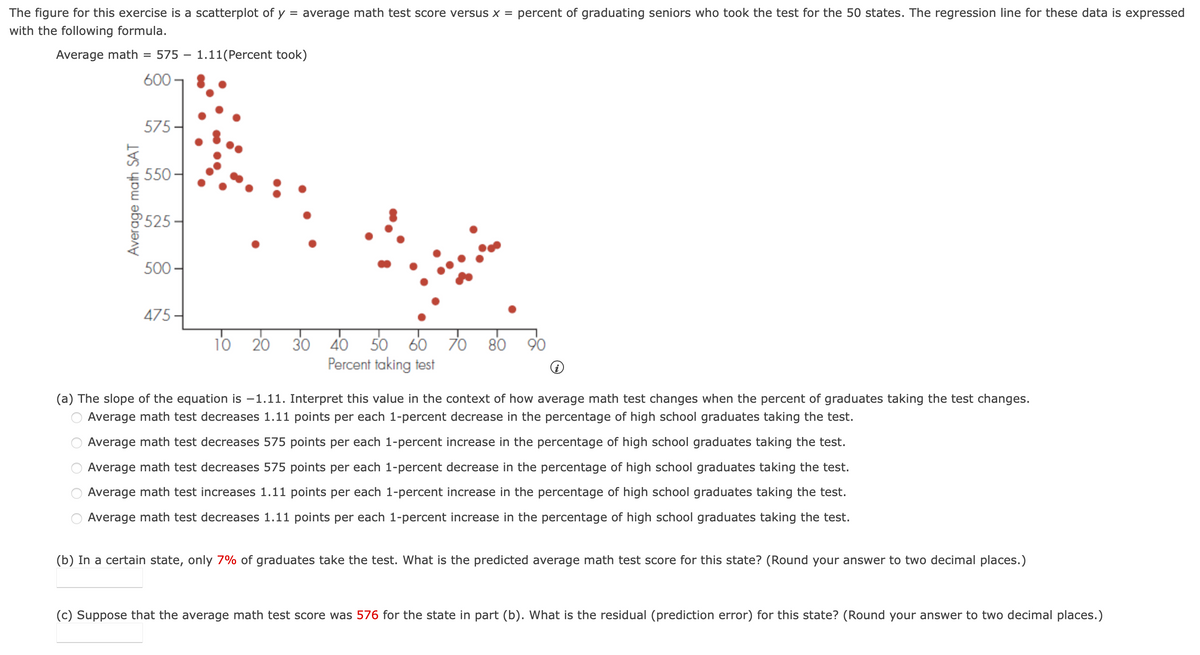
The figure for this exercise is a scatterplot of y with the following formula. Average math = 575 600 Average math SAT 575. 550 $525. 500- - = 1.11(Percent took) average math test score versus x = percent of graduating seniors who took the test for the 50 states. The regression line for these data is expressed 475 10 20 30 40 50 60 70 80 Percent taking test 90 (a) The slope of the equation is -1.11. Interpret this value in the context of how average math test changes when the percent of graduates taking the test changes. Average math test decreases 1.11 points per each 1-percent decrease in the percentage of high school graduates taking the test. Average math test decreases 575 points per each 1-percent increase in the percentage of high school graduates taking the test. Average math test decreases 575 points per each 1-percent decrease in the percentage of high school graduates taking the test. Average math test increases 1.11 points per each 1-percent increase in the percentage of high school graduates taking the test. Average math test decreases 1.11 points per each 1-percent increase in the percentage of high school graduates taking the test. O O O O (b) In a certain state, only 7% of graduates take the test. What is the predicted average math test score for this state? (Round your answer to two decimal places.) (c) Suppose that the average math test score was 576 for the state in part (b). What is the residual (prediction error) for this state? (Round your answer to two decimal places.)
The figure for this exercise is a scatterplot of y with the following formula. Average math = 575 600 Average math SAT 575. 550 $525. 500- - = 1.11(Percent took) average math test score versus x = percent of graduating seniors who took the test for the 50 states. The regression line for these data is expressed 475 10 20 30 40 50 60 70 80 Percent taking test 90 (a) The slope of the equation is -1.11. Interpret this value in the context of how average math test changes when the percent of graduates taking the test changes. Average math test decreases 1.11 points per each 1-percent decrease in the percentage of high school graduates taking the test. Average math test decreases 575 points per each 1-percent increase in the percentage of high school graduates taking the test. Average math test decreases 575 points per each 1-percent decrease in the percentage of high school graduates taking the test. Average math test increases 1.11 points per each 1-percent increase in the percentage of high school graduates taking the test. Average math test decreases 1.11 points per each 1-percent increase in the percentage of high school graduates taking the test. O O O O (b) In a certain state, only 7% of graduates take the test. What is the predicted average math test score for this state? (Round your answer to two decimal places.) (c) Suppose that the average math test score was 576 for the state in part (b). What is the residual (prediction error) for this state? (Round your answer to two decimal places.)

Functions and Change: A Modeling Approach to College Algebra (MindTap Course List)
6th Edition
ISBN:9781337111348
Author:Bruce Crauder, Benny Evans, Alan Noell
Publisher:Bruce Crauder, Benny Evans, Alan Noell
Chapter3: Straight Lines And Linear Functions
Section3.CR: Chapter Review Exercises
Problem 15CR: Life Expectancy The following table shows the average life expectancy, in years, of a child born in...
Question
Transcribed Image Text:The figure for this exercise is a scatterplot of y
with the following formula.
Average math =
575
600
Average math SAT
575.
550
$525.
500-
-
=
1.11(Percent took)
average math test score versus x = percent of graduating seniors who took the test for the 50 states. The regression line for these data is expressed
475
10 20
30
40 50 60 70 80
Percent taking test
90
(a) The slope of the equation is -1.11. Interpret this value in the context of how average math test changes when the percent of graduates taking the test changes.
Average math test decreases 1.11 points per each 1-percent decrease in the percentage of high school graduates taking the test.
Average math test decreases 575 points per each 1-percent increase in the percentage of high school graduates taking the test.
Average math test decreases 575 points per each 1-percent decrease in the percentage of high school graduates taking the test.
Average math test increases 1.11 points per each 1-percent increase in the percentage of high school graduates taking the test.
Average math test decreases 1.11 points per each 1-percent increase in the percentage of high school graduates taking the test.
O O O O
(b) In a certain state, only 7% of graduates take the test. What is the predicted average math test score for this state? (Round your answer to two decimal places.)
(c) Suppose that the average math test score was 576 for the state in part (b). What is the residual (prediction error) for this state? (Round your answer to two decimal places.)
Expert Solution
This question has been solved!
Explore an expertly crafted, step-by-step solution for a thorough understanding of key concepts.

Step by step
Solved in 2 steps

Recommended textbooks for you
Functions and Change: A Modeling Approach to Coll…
Algebra
ISBN:
9781337111348
Author:
Bruce Crauder, Benny Evans, Alan Noell
Publisher:
Cengage Learning

Algebra and Trigonometry (MindTap Course List)
Algebra
ISBN:
9781305071742
Author:
James Stewart, Lothar Redlin, Saleem Watson
Publisher:
Cengage Learning

Algebra & Trigonometry with Analytic Geometry
Algebra
ISBN:
9781133382119
Author:
Swokowski
Publisher:
Cengage
Functions and Change: A Modeling Approach to Coll…
Algebra
ISBN:
9781337111348
Author:
Bruce Crauder, Benny Evans, Alan Noell
Publisher:
Cengage Learning
Algebra and Trigonometry (MindTap Course List)
Algebra
ISBN:
9781305071742
Author:
James Stewart, Lothar Redlin, Saleem Watson
Publisher:
Cengage Learning
Algebra & Trigonometry with Analytic Geometry
Algebra
ISBN:
9781133382119
Author:
Swokowski
Publisher:
Cengage

College Algebra
Algebra
ISBN:
9781305115545
Author:
James Stewart, Lothar Redlin, Saleem Watson
Publisher:
Cengage Learning

Glencoe Algebra 1, Student Edition, 9780079039897…
Algebra
ISBN:
9780079039897
Author:
Carter
Publisher:
McGraw Hill
