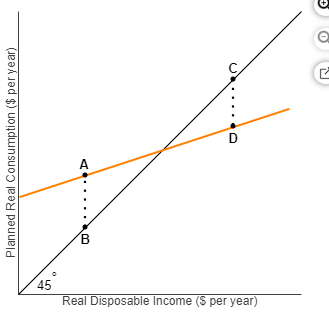
The figure represents the consumption function for a consumer. The distance between C and D represents A. the amount of saving. B. the amount of autonomous consumption. C. the amount of dissaving. D. the point where saving equals zero.


Q: If a country starts with per capita real GDP of $50 and grows at 4% a year; in 5 years it's per…
A: GDP is the gross domestic product. GDP is defined as the market value of all the final goods and…
Q: If the purchase and sale of a currently illegal drug were decriminalized in Texas, economist would…
A: Decriminalization of a currently illegal drug would mean that it would be legal to buy and sell the…
Q: Assume that the graph below reflects the market for pack of cigarettes in Virginia. The vertical…
A: The demand curve is the downward sloping curve. Supply curve is the upward sloping curve.…
Q: Graphically depict how variable ticket pricing leads to sports teams charging different prices for…
A: Variable ticket pricing, also known as dynamic pricing, is a strategy used by businesses, including…
Q: Assuming a normal market, with a positively sloped supply and negatively sloped demand, which is…
A: The supply of a particular good or service is the total amount available on the market. Demand is…
Q: Suppose a firm has an average total cost function given by: ATC = 11094/q +6 + 6q. Calculate the…
A: Total cost is the sum of fixed cost and variable cost.Fixed cost is the cost that doesn't changes…
Q: The output gap is increasing over time because actual GDP is greater than potential GDP when the…
A: The Output Gap is a measure of the difference between a country's actual Gross Domestic Product…
Q: Capital goods Figure 1 A B C . D Consumer goods Refer to Figure 1. At point A, the opportunity cost…
A: The value of the next best choice that must be given up or sacrificed when a decision is made to…
Q: 7) Refer to the graph shown. The marginal rate of substitution at point B is: Units of Machines 20…
A: The marginal rate of substitution (MRS) represents the rate at which a consumer can give up some…
Q: Price per lb. a a Supply E₁ Q₂ Q₁ Quantity D Refer to the above graph, which shows the market for…
A: It can be seen from the graph that demand curve shift from D1 to D2 which result in change in…
Q: A fried chicken franchise finds that the demand equation for its new roast chicken product, "Roasted…
A: Demand for Roasted Rooster is given by Here q denotes the number of quarter chicken servings and p…
Q: Which of the following are consequences of hyperinflation? Check all that apply. ✔People spend…
A: Hyperinflation is an out-of-control increase in prices in the economy. Hyperinflation is a rapid…
Q: Let Var(X) = 25 and Z= 2X +5 Compute Var(Z)
A: The phrase "variance and random variables" refers to a key idea in probability and statistics. It is…
Q: With interest at 10%, what is the benefit-cost ratio for this government project? Initial Cost…
A: The benefit-cost ratio is a financial metric used to evaluate the profitability or…
Q: 1. An increase in expected future output while holding today's output constant would A. increase…
A: Consumption:Consumption is a key concept in economics and refers to how people consume commodities…
Q: Assume that the extraction of water from an aquifer by a coal mining company imposes a cost on…
A: In this scenario, a coal mining company extracts water from an aquifer which leads to an external…
Q: Q 6. Fill in the E Initial Change G 1 C Taxes ↑ I M ↑X ↑ Transfer Payments S LA S y at full employm
A: In economics, the term "multiplier" implies the idea that an initial change in spending or…
Q: Refer to Figure 7-9. At equilibrium, total surplus is represented by the area ⒸaA+B+C…
A: The demand curve is the downward-sloping curve. The supply curve is the upward-sloping curve. The…
Q: Draw a set of AD-AS Model(linear) graphs showing recessionary gap and an inflationary gap. Explain…
A: Aggregate demand is the sum of consumption, investment, government spending and net export. This…
Q: Refer to Table 3-5. If Canada and Japan trad from importing an airplane? O a maximum of 1/3 car a…
A: Understanding opportunity cost and comparative advantage in the context of international trade is…
Q: Suppose a firm is planning to replace a labor intensive production process with an automated robot…
A: The Marginal Rate of Technical Substitution (MRTS) refers to an economic concept that depicts the…
Q: “As long as we do not mind having high inflation, we can achieve as low a level of unemployment as…
A: Expansionary monetary policy reduces unemployment levels by increasing the money supply in the…
Q: (labour) 0 1 2 3 4 5 6 7 Total Product (pots per day) 0 10 25 37 42 45 45 42 Marginal Product (pots…
A: Marginal product is the change in Total product due to an additional labor hired.=> MP = Change…
Q: import substitution strategies substitute cheaper imports for items that are too expensive to…
A: Import Substitution:Import substitution is an economic policy that aims to foster the growth of…
Q: by equa a. Suppose the government increases both taxes (7) and government purchase (Y) is fixed by…
A: The Marginal Propensity to Consume (MPC) is a concept in economics that represents the proportion of…
Q: You are a monopolist serving a single market but you have 2 different factories. The market demand…
A: A monopolistic market, often referred to simply as a monopoly, is a market structure characterized…
Q: In a given population for beverage drinkers, an individual's per kg expenditure on tea (7) and their…
A: The sum of the price paid for one or extra merchandise or offerings accelerated by means of the…
Q: Year 1 2 3 Alta (Real о Multiple Choice GDP) $ 2,000 2,100 2,200 Refer to the table. Between years 2…
A: GDP is the gross domestic product. GDP is defined as the market value of all the final goods and…
Q: Using the graph, complete the table that follows by indicating whether each statement is true or…
A: The price elasticity of demand is calculated as the percentage change in quantity demanded divided…
Q: This question correlates to section 3.3 in the textbook. This graph demonstrates the global market…
A: Market equilibrium occurs when demand meets the supply curve. At the market equilibrium, equilibrium…
Q: Bailey, Inc., is considering buying a new gang punch that would allow them to produce circuit boards…
A: Present value is the value of investment in today's dollar. Future value is the value of investment…
Q: 3. Because people are purposeful A) must be mutually beneficial. B) are basically random. C) usually…
A: Change in Demand:A change in demand refers to a shift in the entire demand curve for a particular…
Q: Refer to the information provided in the figure at right to answer the question that follows. The…
A: Opportunity cost refers to the cost foregone to choose best alternative instead of one good.For…
Q: In the diagram below, monopoly profits are represented by:
A: A monopoly firm produces at MR = MC (i.e., at the intersection of MR and MC curves) to maximize…
Q: Price 3 X 2 1 150 450 300 600 900 Quantity per month 4 10 750 1050,200 1350 Suppose that in December…
A: The demand curve is the downward-sloping curve. The supply curve is the upward-sloping curve. The…
Q: (Table: Demand Schedule of Whatchamacallits) Use Table: Demand Schedule of Whatchamacallits. The…
A: In a monopoly market structure, There exists a single seller. There exists high barriers to entry…
Q: 17. (Figure: Labor Supply and Demand) Refer to the figure. What is the unemployment rate caused by…
A: The labor supply curve depicts the quantity of labor supplied at each possible wage rate.The labor…
Q: Price elasticity of supply is always positive except when supply is a. perfectly inelastic.…
A: Price elasticity of supply signifies the change in the quantity supplied due to an increase in the…
Q: Your time is a scarce resource. What if the quantity of time were increased, say to 48 hours per…
A: Scarcity:Scarcity refers to the basic economic problem that arises because resources (including…
Q: An increase in the number of skilled working-age immigrants and their families to the United States…
A: Labor alludes to the physical or mental exertion applied by individuals in the production of goods…
Q: Table 1 Production Function and Demand for Labor Schedules Quantity of labor demanded 0 2 4…
A: A production function is a mathematical relationship that shows how inputs (such as labor and…
Q: Cj- Si= ¡= B= N= unit cost of item/ cost per order placed for item/ inventory carrying charge as a…
A: The Economic Order Quantity (EOQ) model you presented with budget constraints can be formulated and…
Q: 5. Consider the market represented in Figure below. a. Compute the consumer surplus if the market is…
A: Disclaimer- “Since you have asked multiple questions, we will solve the first three questions for…
Q: Price $30 25 20 15 10 5 T T +- II II D 100 200 300 400 500 600 700 800 Quantity Referring to the…
A: The figure illustrates the demand and supply curves of a good. Price is taken on vertical axis and…
Q: tent for No Smak. A potential new drug, NoSmak, cures lip smacking with one dose, but research and…
A: Patent Protection:In the United States, there is the law to protect the intellectual property of…
Q: Which budget constraint panel in Figure below shows the combined effects of an increase in the price…
A: Budget constraint is said to be a combination of goods that a consumer can purchase with given…
Q: The market for lobster is in equilibrium. Which factor is most likely to INCREASE the equilibrium…
A: Equilibrium is a situation in the market when demand equals the supply in the market.At price which…
Q: Maria likes to use 1 squirt of shampoo (good x) and 1 squirt of conditioner (good y) every time she…
A: As Maria requires 1 unit of both goods X & Y to wash her hair . This would be an example of…
Q: Graph below depicts the market for industrial milk. Price per hectolitre ($) 56 48 40 32 24 16 8 0…
A: The demand curve is the downward-sloping curve. The supply curve is the upward-sloping curve. The…
Q: 37) The above figure shows Bobby's indifference map for soda and juice. B₁ indicates his original…
A: Indifference Curve represents how a combination of two goods in various quantities that provides…
The figure represents the consumption function for a consumer. The distance between C and D represents
A. the amount of saving.
B. the amount of autonomous consumption.
C. the amount of dissaving.
D. the point where saving equals zero.

Step by step
Solved in 3 steps


- In Russia, the value added is $30,000 and value of output is $38,000 Calculate the intermediate consumptionLabel the following as either being a final or intermediate good.A_ Recycled steel purchased by a steel manufacturer.B_ An automobile purchased by a package delivery company.C_A computer purchased by a university for use in the classroom . D_A car purchased by a family.Indicate whether each of the following actions or impacts would increase GDPa. An individual purchases bottled water to avoid a contaminated municipal water supply.b. An individual obtains her drinking water from a water fountain at her workplace to avoid a contaminated municipal water supplyc. A homeowner pays a lawn-care company for landscaping servicesd. A neighbor agrees to help a homeowner with landscaping work in exchange for assistance with plumbing worke. A paper company employs workers to plant treesf. An environmental organization provides volunteers to plant trees
- Measuring Economic Performance (chapter 11) 2. Adam's Ribs in downtown Chicago buys $10,000 worth of beef ribs, $25,000 worth of pork ribs, and $8,000 worth of napkins each month. Are these purchases included in the calculation of gross domestic product? Explain your answer. be creative workWhat is the measure of the income earned by owners of resources used in making final goods and services? a. personal income b. gross domestic income c. retained earnings d. national incomeState with valid reason, which of the following statement is true or false: a. Gross Value Added at market price and Gross Domestic Product at market price are one and the same thing. b. Intermediate goods are always durable in nature.
- The Compagnie Naturelle sells mounted butterflies, using butterfly bait it buys from another firm for $20,000. It pays its workers $35,000, pays $1000 in taxes, and has profits of $3,000. What is its value added?True or False: Personal Consumption Expenditures account for about 25% of GDP. Spending on Consumer Durable Goods tends to be very stable from year to year. Sales of used goods are included in GDP at 35% of their original sale price.An industry buys $3.75 million worth of resources to make a product. The industry makes 750,000 units of the product and each of them sells for $27. What is the value added per unit in that industry
- Say the GDP of a country is $100. To this foreign nationals' contribution is $5. Government gives $2 as transfer payments such as social security allowances to the citizens, corporations' retained profit is $3. Personal income tax is $1. Depreciation is $2 and statistical discrepancy is $1. What is the personal disposable income?Identify the part of the personal income which is actually available for consumption a.Consumption income b.Disposable income c.National income d.Taxable incomIn Brazil, The value of output is $21,000 and the value of intermediate consumption is $15500 Calculate the value added
