The figure shows the output from the SIR model that you used in lab. One or more of the curves shown represent a population that had an initial fraction infected of 0.03. Which curve or curves match this description? Select all that apply. A B 0.05 0.10 0.15 0.20 0.25 0.30 Susceptible Hosts C E 80'0 90'0 00'0 0.02 Infected Hosts
The figure shows the output from the SIR model that you used in lab. One or more of the curves shown represent a population that had an initial fraction infected of 0.03. Which curve or curves match this description? Select all that apply. A B 0.05 0.10 0.15 0.20 0.25 0.30 Susceptible Hosts C E 80'0 90'0 00'0 0.02 Infected Hosts

Chapter2: Safety In Phlebotomy
Section: Chapter Questions
Problem 2RQ

Related questions

Question
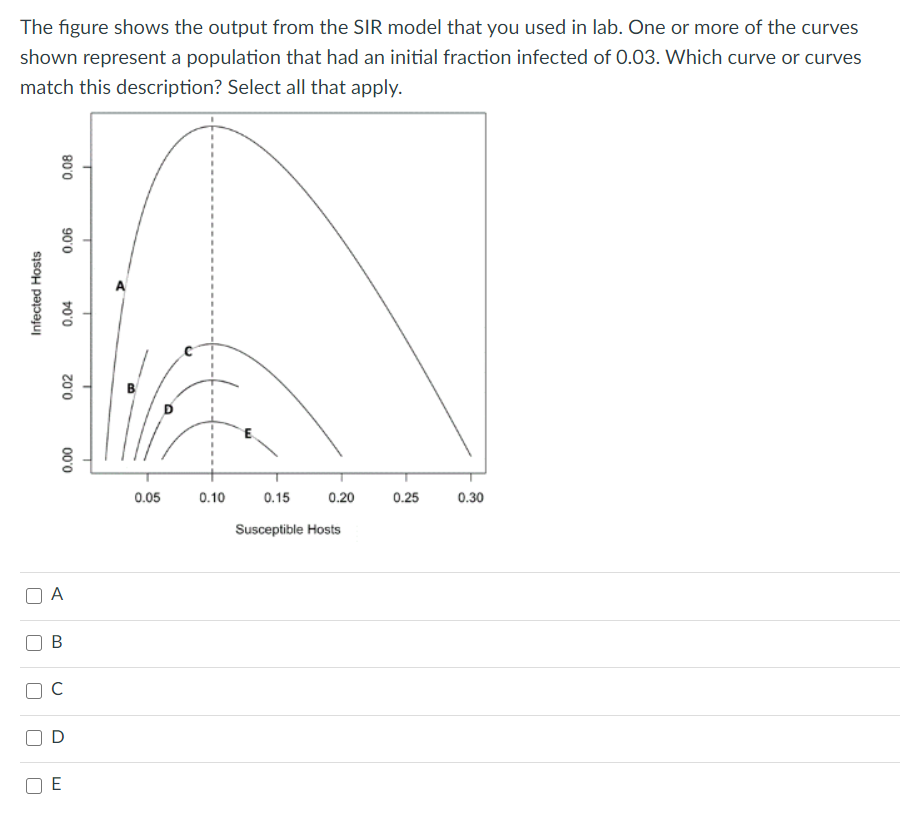
Transcribed Image Text:The figure shows the output from the SIR model that you used in lab. One or more of the curves
shown represent a population that had an initial fraction infected of 0.03. Which curve or curves
match this description? Select all that apply.
0.05
0.10
0.15
0.20
0.25
0.30
Susceptible Hosts
A
Infected Hosts
B.
0.02
0.04
0.08
000
90'0
Expert Solution
This question has been solved!
Explore an expertly crafted, step-by-step solution for a thorough understanding of key concepts.

Step by step
Solved in 2 steps

Knowledge Booster


Learn more about
Need a deep-dive on the concept behind this application? Look no further. Learn more about this topic, biology and related others by exploring similar questions and additional content below.Recommended textbooks for you