Figure A FigureB Figure C allh Measurement t From: "Why our flu vaccines can't keep up" Which one of the graphs shows the frequency of trait variation in the surviving sparrow population after the storm.?
Figure A FigureB Figure C allh Measurement t From: "Why our flu vaccines can't keep up" Which one of the graphs shows the frequency of trait variation in the surviving sparrow population after the storm.?

Biology: The Unity and Diversity of Life (MindTap Course List)
15th Edition
ISBN:9781337408332
Author:Cecie Starr, Ralph Taggart, Christine Evers, Lisa Starr
Publisher:Cecie Starr, Ralph Taggart, Christine Evers, Lisa Starr
Chapter44: Population Ecology
Section: Chapter Questions
Problem 1SQ: Most commonly, individuals of a population show a _______ distribution within their habitat. a....

Related questions
Question
Transcribed Image Text:Figure A
Far
Figure C
3:
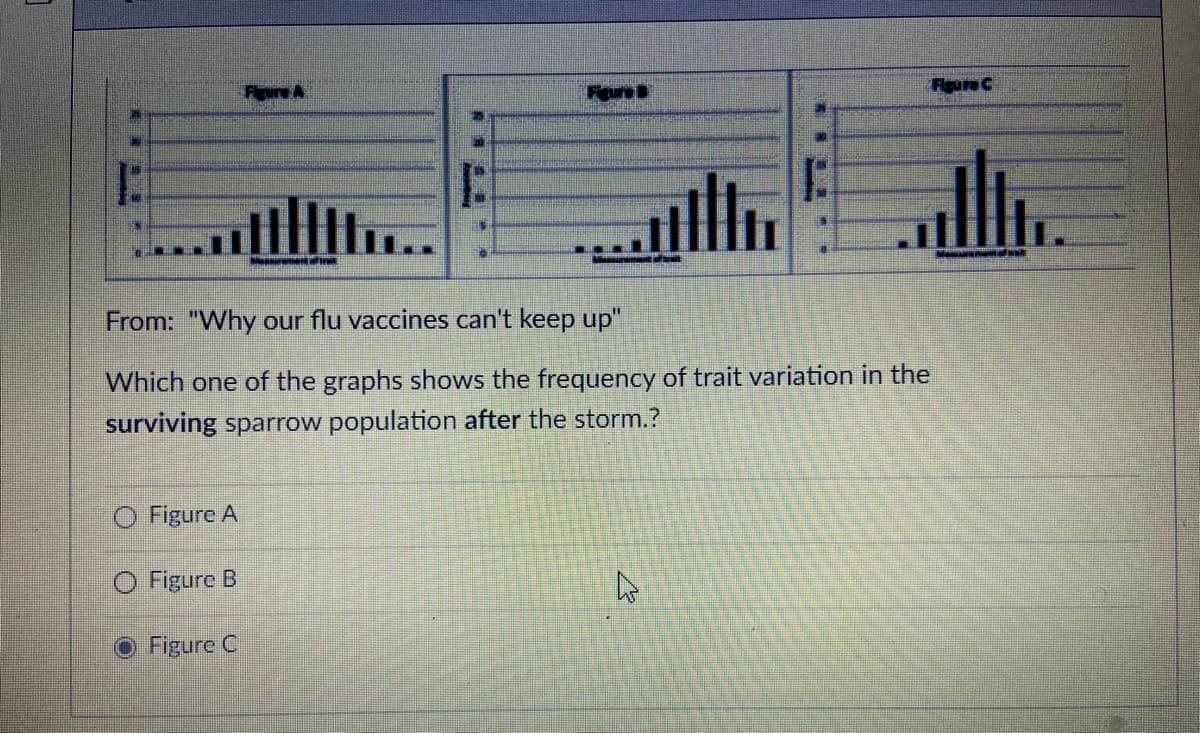
From: "Why our flu vaccines can't keep up"
Which one of the graphs shows the frequency of trait variation in the
surviving sparrow population after the storm.?
Figure A
O Figure B
O Figure C
Expert Solution
This question has been solved!
Explore an expertly crafted, step-by-step solution for a thorough understanding of key concepts.

This is a popular solution!

Trending now
This is a popular solution!

Step by step
Solved in 2 steps

Knowledge Booster


Learn more about
Need a deep-dive on the concept behind this application? Look no further. Learn more about this topic, biology and related others by exploring similar questions and additional content below.Recommended textbooks for you
Biology: The Unity and Diversity of Life (MindTap…
Biology
ISBN:
9781337408332
Author:
Cecie Starr, Ralph Taggart, Christine Evers, Lisa Starr
Publisher:
Cengage Learning

Biology (MindTap Course List)
Biology
ISBN:
9781337392938
Author:
Eldra Solomon, Charles Martin, Diana W. Martin, Linda R. Berg
Publisher:
Cengage Learning
Biology: The Unity and Diversity of Life (MindTap…
Biology
ISBN:
9781337408332
Author:
Cecie Starr, Ralph Taggart, Christine Evers, Lisa Starr
Publisher:
Cengage Learning
Biology (MindTap Course List)
Biology
ISBN:
9781337392938
Author:
Eldra Solomon, Charles Martin, Diana W. Martin, Linda R. Berg
Publisher:
Cengage Learning