The figure to the right shows the number of full-time employees of a company (in millions) as a function of the revenue generated by the company (in billions). Find and interpret the average rate of change of employees with respect to revenue for the following changes in revenue. 70- 60- (106,59). 50- (a) $5 billion to $32 billion (b) $32 billion to $106 billion (c) $5 billion to $106 billion 40- 32,32) 30- 20어 10-5,11 0- 20 40 60 80 100 120 Revenue (billions) (a) The average rate of change of employees with respect to revenue for the changes from $5 billion to $32 billion is about employees/billion dollars. (Round to the nearest thousands as needed.) Employees (millions)
The figure to the right shows the number of full-time employees of a company (in millions) as a function of the revenue generated by the company (in billions). Find and interpret the average rate of change of employees with respect to revenue for the following changes in revenue. 70- 60- (106,59). 50- (a) $5 billion to $32 billion (b) $32 billion to $106 billion (c) $5 billion to $106 billion 40- 32,32) 30- 20어 10-5,11 0- 20 40 60 80 100 120 Revenue (billions) (a) The average rate of change of employees with respect to revenue for the changes from $5 billion to $32 billion is about employees/billion dollars. (Round to the nearest thousands as needed.) Employees (millions)

Chapter3: Functions
Section3.5: Transformation Of Functions
Problem 3SE: When examining the formula of a function that is the result of multiple transformations, how can you...

Related questions

Question
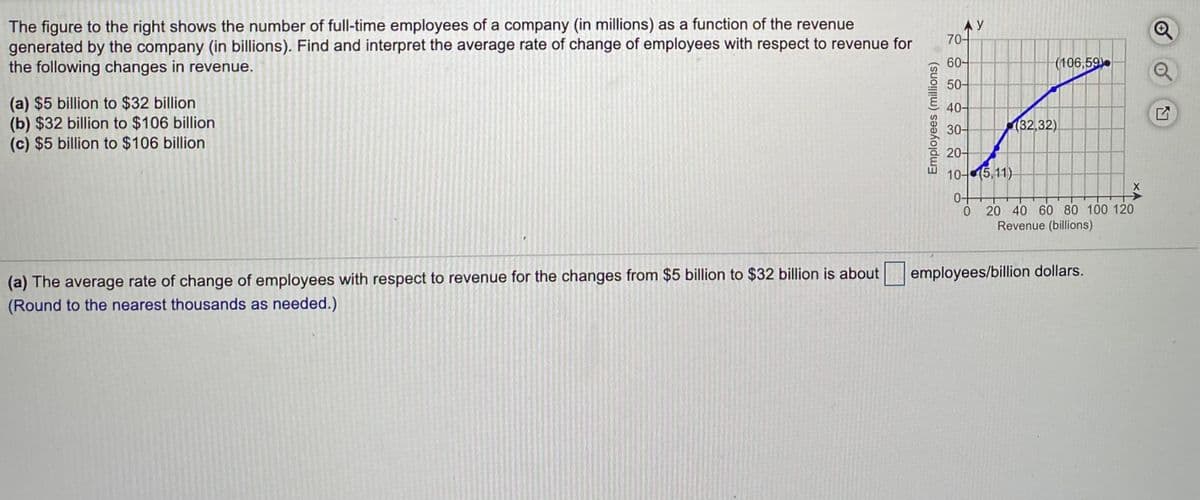
Transcribed Image Text:The figure to the right shows the number of full-time employees of a company (in millions) as a function of the revenue
generated by the company (in billions). Find and interpret the average rate of change of employees with respect to revenue for
the following changes in revenue.
AY
70-
60-
(106,59)
50-
(a) $5 billion to $32 billion
(b) $32 billion to $106 billion
(c) $5 billion to $106 billion
40-
30-
(32,32)
20-
10-(5,11)
20 40 60 80 100 120
Revenue (billions)
employees/billion dollars.
(a) The average rate of change of employees with respect to revenue for the changes from $5 billion to $32 billion is about
(Round to the nearest thousands as needed.)
Employees (millions)
Expert Solution
This question has been solved!
Explore an expertly crafted, step-by-step solution for a thorough understanding of key concepts.

This is a popular solution!

Trending now
This is a popular solution!

Step by step
Solved in 4 steps with 1 images

Knowledge Booster


Learn more about
Need a deep-dive on the concept behind this application? Look no further. Learn more about this topic, calculus and related others by exploring similar questions and additional content below.Recommended textbooks for you

Glencoe Algebra 1, Student Edition, 9780079039897…
Algebra
ISBN:
9780079039897
Author:
Carter
Publisher:
McGraw Hill

Algebra and Trigonometry (MindTap Course List)
Algebra
ISBN:
9781305071742
Author:
James Stewart, Lothar Redlin, Saleem Watson
Publisher:
Cengage Learning
Glencoe Algebra 1, Student Edition, 9780079039897…
Algebra
ISBN:
9780079039897
Author:
Carter
Publisher:
McGraw Hill
Algebra and Trigonometry (MindTap Course List)
Algebra
ISBN:
9781305071742
Author:
James Stewart, Lothar Redlin, Saleem Watson
Publisher:
Cengage Learning

College Algebra
Algebra
ISBN:
9781305115545
Author:
James Stewart, Lothar Redlin, Saleem Watson
Publisher:
Cengage Learning