The financial statements for Royale and Cavalier companies are summarized here: Royale Cavalier Company Company Balance Sheet Cash Accounts Receivable, Net Inventory Equipment, Net Other Assets Total Assets Current Liabilities Note Payable (long-term) Common Stock (par $20) Additional Paid-in Capital Retained Earnings Total Liabilities and Stockholders' Equity Income Statement Sales Revenue Cost of Goods Sold Other Expenses Net Income Other Data Per share price at end of year Selected Data from Previous Year Accounts Receivable, Net Note Payable (long-term) Equipment, Net Inventory Total Stockholders' Equity $ 27,000 $ 47,000 57.000 18,000 114,000 29,000 554,000 164,000 142,000 48,000 $894,000 $306,000 $124,000 $ 19,000 194,000 59,000 482,000 212,000 52,000 42,000 6,000 10,000 $894,000 $306,000 $806,000 $286,000 482,000 152,000 242,000 97,000 $ 82,000 $ 37,000 $ 20.00 $ 16.00 $ 49,000 $ 16,000 194,000 59,000 164,000 554,000 97,000 40.000 576,000 228,000 These two companies are in the same business and state but different cities. Each company has been in operation for about 10 years. Both companies received an unqualified audit opinion on the financial statements. Royale Company wants to borrow $77,000 cash and Cavalier Company is asking for $32,000. The loans will be for a two-year period. Both companies estimate bad debts based on an aging analys but Cavalier has estimated slightly higher uncollectible rates than Royale. Neither company issued stock in the current year. Assume the end-of-year total assets and net equipment balances approximate the year's average and all sales are on account.
The financial statements for Royale and Cavalier companies are summarized here: Royale Cavalier Company Company Balance Sheet Cash Accounts Receivable, Net Inventory Equipment, Net Other Assets Total Assets Current Liabilities Note Payable (long-term) Common Stock (par $20) Additional Paid-in Capital Retained Earnings Total Liabilities and Stockholders' Equity Income Statement Sales Revenue Cost of Goods Sold Other Expenses Net Income Other Data Per share price at end of year Selected Data from Previous Year Accounts Receivable, Net Note Payable (long-term) Equipment, Net Inventory Total Stockholders' Equity $ 27,000 $ 47,000 57.000 18,000 114,000 29,000 554,000 164,000 142,000 48,000 $894,000 $306,000 $124,000 $ 19,000 194,000 59,000 482,000 212,000 52,000 42,000 6,000 10,000 $894,000 $306,000 $806,000 $286,000 482,000 152,000 242,000 97,000 $ 82,000 $ 37,000 $ 20.00 $ 16.00 $ 49,000 $ 16,000 194,000 59,000 164,000 554,000 97,000 40.000 576,000 228,000 These two companies are in the same business and state but different cities. Each company has been in operation for about 10 years. Both companies received an unqualified audit opinion on the financial statements. Royale Company wants to borrow $77,000 cash and Cavalier Company is asking for $32,000. The loans will be for a two-year period. Both companies estimate bad debts based on an aging analys but Cavalier has estimated slightly higher uncollectible rates than Royale. Neither company issued stock in the current year. Assume the end-of-year total assets and net equipment balances approximate the year's average and all sales are on account.

Managerial Accounting: The Cornerstone of Business Decision-Making
7th Edition
ISBN:9781337115773
Author:Maryanne M. Mowen, Don R. Hansen, Dan L. Heitger
Publisher:Maryanne M. Mowen, Don R. Hansen, Dan L. Heitger
Chapter15: Financial Statement Analysis
Section: Chapter Questions
Problem 20BEA: The income statement, statement of retained earnings, and balance sheet for Somerville Company are...

Related questions
Question
Please do not give image format and explanation
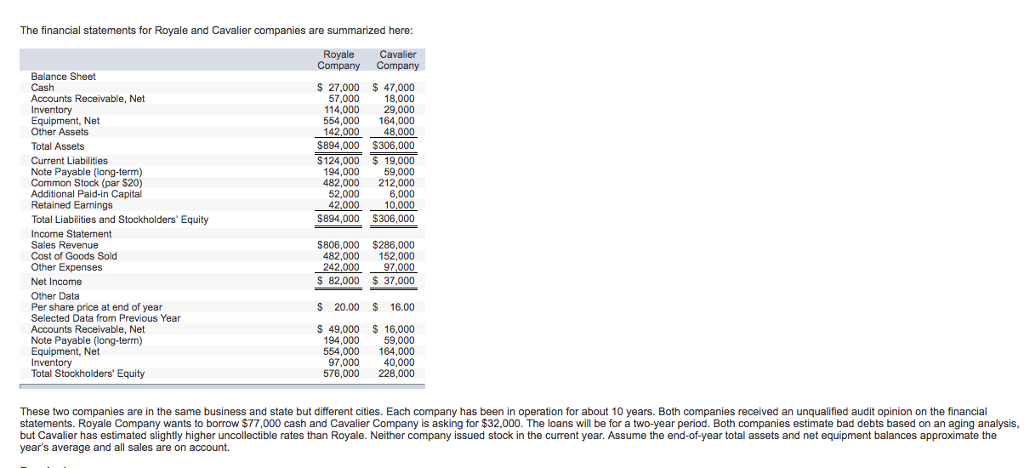
Transcribed Image Text:The financial statements for Royale and Cavalier companies are summarized here:
Royale Cavalier
Company
Company
Balance Sheet
Cash
Accounts Receivable, Net
Inventory
Equipment, Net
Other Assets
Total Assets
Current Liabilities
Note Payable (long-term)
Common Stock (par $20)
Additional Paid-in Capital
Retained Earnings
Total Liabilities and Stockholders' Equity
Income Statement
Sales Revenue
Cost of Goods Sold
Other Expenses
Net Income
Other Data
Per share price at end of year
Selected Data from Previous Year
Accounts Receivable, Net
Note Payable (long-term)
Equipment, Net
Inventory
Total Stockholders' Equity
$ 27,000 $ 47,000
57,000
18,000
29.000
114,000
554,000 164,000
142,000
48,000
$894,000 $306,000
$124,000 $19,000
194,000
59,000
482,000 212,000
6,000
10,000
$894,000 $306,000
52,000
42,000
$806,000 $286,000
482,000
242,000
$ 82,000
152,000
97,000
$37,000
$ 20.00 $ 16.00
$ 49,000
$16,000
194,000 59,000
554,000 164,000
97,000 40,000
576,000 228,000
These two companies are in the same business and state but different cities. Each company has been in operation for about 10 years. Both companies received an unqualified audit opinion on the financial
statements. Royale Company wants to borrow $77,000 cash and Cavalier Company is asking for $32,000. The loans will be for a two-year period. Both companies estimate bad debts based on an aging analysis,
but Cavalier has estimated slightly higher uncollectible rates than Royale. Neither company issued stock in the current year. Assume the end-of-year total assets and net equipment balances approximate the
year's average and all sales are on account.
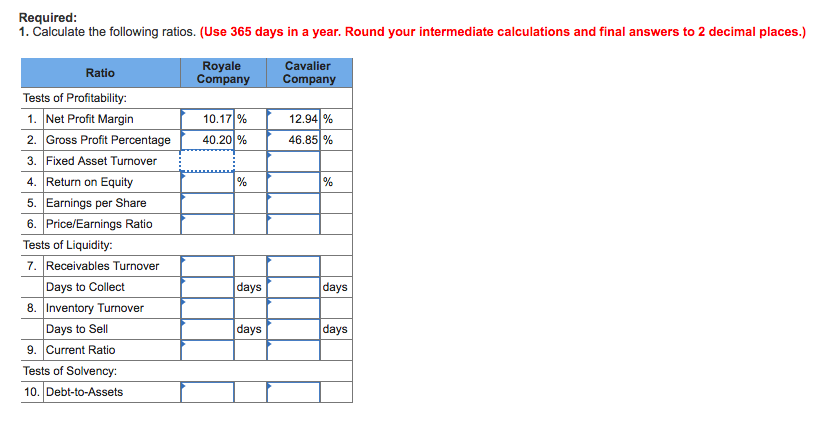
Transcribed Image Text:Required:
1. Calculate the following ratios. (Use 365 days in a year. Round your intermediate calculations and final answers to 2 decimal places.)
Ratio
Tests of Profitability:
1. Net Profit Margin
2. Gross Profit Percentage
3. Fixed Asset Turnover
4. Return on Equity
5. Earnings per Share
6. Price/Earnings Ratio
Tests of Liquidity:
7. Receivables Turnover
Days to Collect
8. Inventory Turnover
Days to Sell
9. Current Ratio
Tests of Solvency:
10. Debt-to-Assets
Royale
Company
10.17 %
40.20 %
%
days
days
Cavalier
Company
12.94 %
46.85 %
%
days
days
Expert Solution
This question has been solved!
Explore an expertly crafted, step-by-step solution for a thorough understanding of key concepts.

This is a popular solution!

Trending now
This is a popular solution!

Step by step
Solved in 5 steps

Recommended textbooks for you
Managerial Accounting: The Cornerstone of Busines…
Accounting
ISBN:
9781337115773
Author:
Maryanne M. Mowen, Don R. Hansen, Dan L. Heitger
Publisher:
Cengage Learning


Managerial Accounting
Accounting
ISBN:
9781337912020
Author:
Carl Warren, Ph.d. Cma William B. Tayler
Publisher:
South-Western College Pub
Managerial Accounting: The Cornerstone of Busines…
Accounting
ISBN:
9781337115773
Author:
Maryanne M. Mowen, Don R. Hansen, Dan L. Heitger
Publisher:
Cengage Learning
Managerial Accounting
Accounting
ISBN:
9781337912020
Author:
Carl Warren, Ph.d. Cma William B. Tayler
Publisher:
South-Western College Pub

Financial And Managerial Accounting
Accounting
ISBN:
9781337902663
Author:
WARREN, Carl S.
Publisher:
Cengage Learning,

Financial Accounting
Accounting
ISBN:
9781337272124
Author:
Carl Warren, James M. Reeve, Jonathan Duchac
Publisher:
Cengage Learning

Financial Reporting, Financial Statement Analysis…
Finance
ISBN:
9781285190907
Author:
James M. Wahlen, Stephen P. Baginski, Mark Bradshaw
Publisher:
Cengage Learning