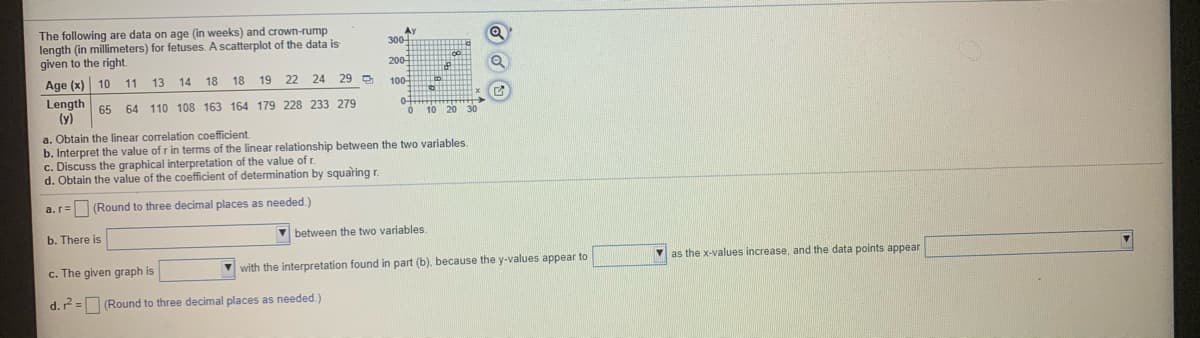
The following are data on age (in weeks) and crown-rump length (in millimeters) for fetuses. A scatterplot of the data is given to the right Age (x) 10 11 13 14 18 Length 65 (y) 300- 200 18 19 22 24 29 D 100 64 110 108 163 164 179 228 233 279 a. Obtain the linear correlation coefficient. b. Interpret the value of r in terms of the linear relationship between the two variables. c. Discuss the graphical interpretation of the value of r. d. Obtain the value of the coefficient of determination by squaring r a.r=(Round to three decimal places as needed.) b. There is V between the two variables. as the x-values increase, and the data points appear c. The given graph is with the interpretation found in part (b), because the y-values appear to d. = (Round to three decimal places as needed.)


Inverse Normal Distribution
The method used for finding the corresponding z-critical value in a normal distribution using the known probability is said to be an inverse normal distribution. The inverse normal distribution is a continuous probability distribution with a family of two parameters.
Mean, Median, Mode
It is a descriptive summary of a data set. It can be defined by using some of the measures. The central tendencies do not provide information regarding individual data from the dataset. However, they give a summary of the data set. The central tendency or measure of central tendency is a central or typical value for a probability distribution.
Z-Scores
A z-score is a unit of measurement used in statistics to describe the position of a raw score in terms of its distance from the mean, measured with reference to standard deviation from the mean. Z-scores are useful in statistics because they allow comparison between two scores that belong to different normal distributions.


Trending now
This is a popular solution!

Step by step
Solved in 4 steps with 2 images


