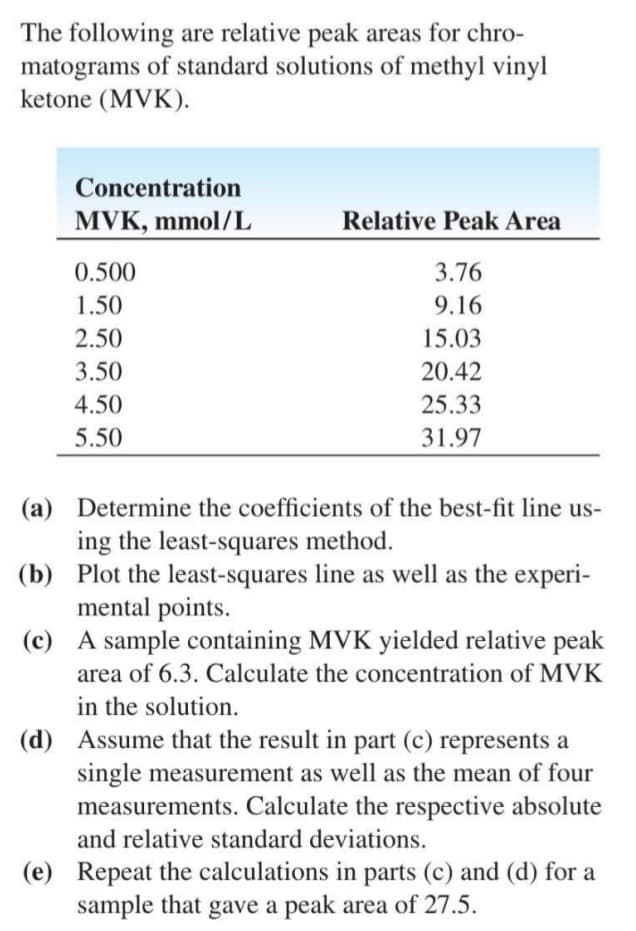
The following are relative peak areas for chro- matograms of standard solutions of methyl vinyl ketone (MVK). Concentration MVK, mmol/L Relative Peak Area 0.500 3.76 1.50 9.16 2.50 15.03 3.50 20.42 4.50 25.33 5.50 31.97 (a) Determine the coefficients of the best-fit line us- ing the least-squares method. (b) Plot the least-squares line as well as the experi- mental points. (c) A sample containing MVK yielded relative peak area of 6.3. Calculate the concentration of MVK in the solution. (d) Assume that the result in part (c) represents a single measurement as well as the mean of four measurements. Calculate the respective absolute and relative standard deviations.
The following are relative peak areas for chro- matograms of standard solutions of methyl vinyl ketone (MVK). Concentration MVK, mmol/L Relative Peak Area 0.500 3.76 1.50 9.16 2.50 15.03 3.50 20.42 4.50 25.33 5.50 31.97 (a) Determine the coefficients of the best-fit line us- ing the least-squares method. (b) Plot the least-squares line as well as the experi- mental points. (c) A sample containing MVK yielded relative peak area of 6.3. Calculate the concentration of MVK in the solution. (d) Assume that the result in part (c) represents a single measurement as well as the mean of four measurements. Calculate the respective absolute and relative standard deviations.

Linear Algebra: A Modern Introduction
4th Edition
ISBN:9781285463247
Author:David Poole
Publisher:David Poole
Chapter7: Distance And Approximation
Section7.3: Least Squares Approximation
Problem 31EQ

Related questions
Question
ANSWER C AND D
Transcribed Image Text:The following are relative peak areas for chro-
matograms of standard solutions of methyl vinyl
ketone (MVK).
Concentration
MVK, mmol/L
Relative Peak Area
0.500
3.76
1.50
9.16
2.50
15.03
3.50
20.42
4.50
25.33
5.50
31.97
(a) Determine the coefficients of the best-fit line us-
ing the least-squares method.
(b) Plot the least-squares line as well as the experi-
mental points.
(c) A sample containing MVK yielded relative peak
area of 6.3. Calculate the concentration of MVK
in the solution.
Assume that the result in part (c) represents a
single measurement as well as the mean of four
measurements. Calculate the respective absolute
(d)
and relative standard deviations.
(e) Repeat the calculations in parts (c) and (d) for a
sample that gave a peak area of 27.5.
Expert Solution
This question has been solved!
Explore an expertly crafted, step-by-step solution for a thorough understanding of key concepts.

This is a popular solution!

Trending now
This is a popular solution!

Step by step
Solved in 5 steps

Recommended textbooks for you
Linear Algebra: A Modern Introduction
Algebra
ISBN:
9781285463247
Author:
David Poole
Publisher:
Cengage Learning
Linear Algebra: A Modern Introduction
Algebra
ISBN:
9781285463247
Author:
David Poole
Publisher:
Cengage Learning