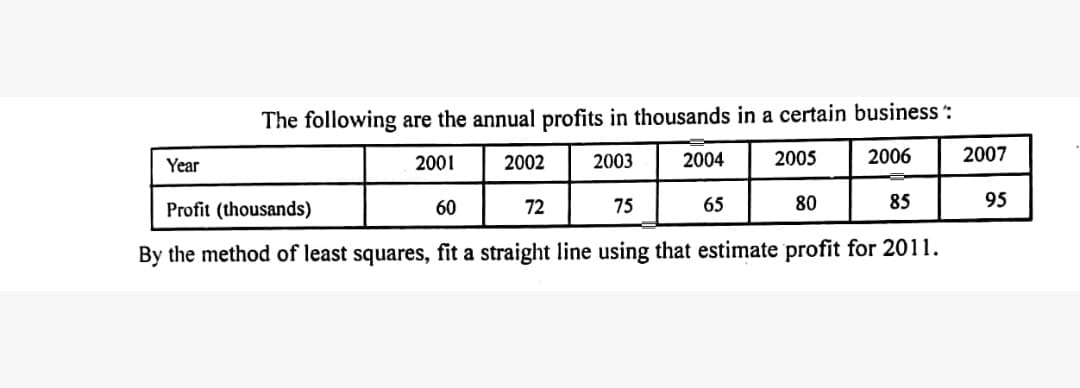
The following are the annual profits in thousands in a certain business: Year 2001 2002 2003 2004 2005 2006 2007 Profit (thousands) 75 65 80 85 95 60 72 By the method of least squares, fit a straight line using that estimate profit for 2011.


Q: Use the Central Limit Theorem to find the mean and standard error of the mean of the sampling distri...
A:
Q: A researcher randomly selected 70 of the nation's middle schools and interviewed all of the teachers...
A: According to the answering guidelines, we can answer only one question at a time and the rest can be...
Q: Find the 7h decile and 60h percentile from the following data : Wages ( $) 30-40 40-50 50 60 60 70 7...
A:
Q: A. Classify each random variable as discrete or continuous. 1. X: Number of women among 20 newly hir...
A:
Q: Xn be a random sample from Let X,, X2, Beta (a, B) where a is known- Show that is sufficient for a. ...
A: Given that X1, X2, . . ., Xn be a random sample from Betaα,β, where α is known.
Q: Inorganic phosphorous is a naturally occurring element in all plants and animals, with concentration...
A: CI=(x̄1 - x̄2) ± ME
Q: 2. Let X be a random sample form N(0, E). Find the complete sufficient statistic for e.
A:
Q: B. Determine if each table is a discrete probability distribution or not. 1) 1 4) a 2 4 6. 8. P(x) 1...
A: Given1)
Q: Example 3-42. The odds that person X speaks the truth are rson Y speaks the truth are 5:3. In what p...
A: Given data, The odds that person X speaks the truth are 3 : 2 P(X speaks truth)=3/5 P(X speaks lie)=...
Q: $ 5000. The Average $ 5000 and $ 4200, respectively. Find the percentage The average wages paid to a...
A:
Q: Problem II. Assume x is nomally distributed with o= 3. Use the approximate areas beneath the norn 6....
A: Note: According to Bartleby guidelines expert solve only one question and maximum 3 subpart of the f...
Q: If arithmetic mean and geometric mean of two values are 10 and 8 respectively, find values.
A:
Q: Example 4. Calculate Coefficient of Correlation from the following results : n= 10, ΣX = 100, ΣΥ - 1...
A:
Q: For large U.S. companies, what percentage of their total income comes from foreign sales? A random s...
A: “Since you have posted a question with multiple sub-parts, we will solve first three subparts for yo...
Q: Example 12. Consider the following distribution : Distribution - A Distribution - B Mean 100 90 80 0...
A:
Q: The area under the normal curve is 10. Select the correct response: O True False
A: Hey there! Thank you for posting the question. Since there are multiple questions posted, we will an...
Q: $ 5000. The Average $ 5000 and $ 4200, respectively. Find the percentage The average wages paid to a...
A:
Q: Independent random samples of professional football and basketball players gave the following inform...
A: CI=(x̄1 - x̄2) ± ME
Q: The manager of a credit card firm has recorded the times for a simple random sample of 60 calls made...
A:
Q: Based on historical data, an insurance company estimates that a particular customer has a 1.5% likel...
A:
Q: Errors" (Vol. 19, 1977)] presents data on the selling price and annual taxes for 24 houses. The data...
A: As per bartleby rule i solved first three sub parts only. kindly repost the another subpart.
Q: Example 5. Calculate Quartile Deviation and its Coefficient from the following data : Weight (in pou...
A:
Q: The observed values of a function are respectively 168, 120, 72 and 63 at /the four positions 3, 7, ...
A: To find the best estimate of a functional value corresponding to a particular value of the independe...
Q: The population mean and standard deviation are given below. Find the required probability and determ...
A:
Q: Activity 1 A. Evaluate the following. )(0.3)°(0.7)2 1. )0.2)*(0.8)3 2. 3. ()(0.4)2(0.8)³
A:
Q: A combustion system has two burners, each with its own fuel inlet with its own shut-off valve. The p...
A:
Q: The numbers 3.2, 5.8, 7.9, and 4.5 have frequencies x, (x + 2), (x – 3), and (x + 6) respectively. I...
A:
Q: For 50 students of a class the regression equation of marks in Statistics (X) on the marks in Accoun...
A:
Q: According to Chemical Engineering Progress (November 1990), approximately 30% of all pipework failur...
A: According to Chemical Engineering Progress (November 1990), approximately 30% of all pipework failur...
Q: Calculate mean deviation (from arithmetic mean) from the following values : 100.500 100.250 100.375 ...
A:
Q: What are the quartiles of a distribution? How do we find them? What are the quartiles of a distribut...
A: Given that We have to define the Quartile and how to find it:
Q: Suppose a family uses a lock-in their home that opens by using a lock code that is a product of two ...
A: Given that a family uses a lock-in their home that opens by using a lock code that is a product of t...
Q: 3. In a study of life expectancy of 400 people in a certain geographic region, the mean age at death...
A: 1) Given information Mean μ = 70 Standard deviation ? = 5.1 Sample mean x̅ = 68 n = 50 2) We need to...
Q: The arithmetic mean of two observations is 127.5, and their geometric mean is 60. Find their harmoni...
A: the arithmetic mean of two observations(let a and b) is 127.5 and their geometric mean is 60.i.e. a+...
Q: llustration 10. You are given the following data: Y Arithmetic Mean 36 85 Standard Deviation 11 8 Co...
A:
Q: Calculate mean deviation from median and also its co-efficient for the following Example 4 frequency...
A:
Q: What is the standard error of the sampling dis- tribution of the mean for the following? a. o, = 48,...
A:
Q: Find the characteristic function of the Poisson distribution and hence find the values of the first ...
A:
Q: 4. An insurance company has a portfolio of 10,000 policies. Based on past data the company estimates...
A:
Q: Use the normal distribution of SAT critical reading scores for which the mean is 505 and the standar...
A:
Q: Use the method of moment to estimate the parameter O for the based on a random sample Xi, X2, a suff...
A:
Q: Theorem 3.10. If the events A and B are such that P(A) #0, P(B) ±0 and A is independent of B, then B...
A:
Q: What is the sample size now? What religious category is the mode? What percentage are in this catego...
A: Given information: Valid Frequency Percent Valid Percent Cumulative Percent No religion 21 ...
Q: To investigate the association between eye-colour of husband and eye-colour of wife, the following d...
A:
Q: 3. Refer to the speed at which cars pass through a checkpoint. Assume the speed are normally distrib...
A:
Q: Lotteries The Sad State Lottery requires you to select a sequence of three different numbers from 0 ...
A:
Q: From the data given below estimate the number of persons living between the age of 35 and 42 : Age (...
A:
Q: distribution's missing probability (3) value. 1 2 4 P(x) 0.07 0.20 0.38 0.13 O 0.21 0.22 0.23 O 0.24...
A: Handwritten solution
Q: The following table shows the COVID cases and deaths for 21 selected countries based on data from th...
A: Given :
Q: The population consists of the ages of 5 children, as follows: 2,5,8,11, and 14. Construct a samplin...
A: Let us assume all possible random samples of the same size are considered that have been drawn from ...


Trending now
This is a popular solution!

Step by step
Solved in 2 steps with 2 images

- The following are the scores that 12 students obtainedon the midterm and final examinations in a course instatistics:Midterm examination Final examinationx y71 8349 6280 7673 7793 8985 7458 4882 7864 7632 5187 7380 89 (a) Find the equation of the least squares line that willenable us to predict a student’s final examination score inthis course on the basis of his or her score on the midtermexamination.(b) Predict the final examination score of a student whoreceived an 84 on the midterm examination.When a least squares line is fit to the 12 observations in the labor cost data, we obtain SSE =656, 214.3589. Calculate s2 and s (isnt n-k-1)?Each of the following pairs represents the number of licensed drivers (X) and the number of cars (Y) for seven houses in my neighborhood: Drivers X Cars Y 5 4 5 3 2 2 2 2 3 2 1 1 2 2 Construct a scatterplot to verify a lack of pronounced curvilinearity. Determine the least squares equation for these data. (Remember, you will first have to calculate r, SSy, and SSx) Determine the standard error of estimate, sy|x, given that n = 7. Predict the number of cars for each of two new families with two and five drivers.
- An owner of a home in the Midwest installed solar panels to reduce heating costs. After installing the solar panels, he measured the amount of natural gas used ? (in cubic feet) to heat the home and outside temperature ? (in degree‑days, where a day’s degree‑days are the number of degrees its average temperature falls below 65 ∘F ) over a 23-month period. He then computed the least‑squares regression line for predicting ? from ? and found it to be ?̂ =85+16?. By looking at the equation of the least‑squares regression line, you can see that the correlation between amount of gas used and degree‑days isPercentages of public school students in fourth and eighth grades who were above the proficiency level were given for 8 western states 4th Grade Proficiency 8th Grade Proficiency Arizona 15 21 California 11 18 Hawaii 16 16 Montana 22 37 New Mexico 13 13 Oregon 21 32 Utah 23 26 Wyoming 19 25 Construct a scatterplot and comment on any interesting characteristics Find the least squares equation. If Nevada had a 4th grade proficiency of 14%, what would you expect the 8th grade proficiency to be?In order to study the relationship between age and length of time that a smoker has been smoking, the following data were collected. x= age of a smoker y= years since he or she started smoking. x = y= 26 8 32 9 27 7 24 6 34 10 20 4 Compute the coorelation and find the least squares line.
- The following table is an abbreviated life expectancy table for males. current age, x 0 20 40 60 80 life expectancy, y 76.6 years 78.9 years 80.5 years 81.7 years 82.7 years a. Find the straight line that provides the best least-squares fit for these data.A regression analysis between sales (in $1000) and advertising (in $100) resulted in the following least squares line: ŷ = 75 + 6x. This implies that if advertising is $800, then the predicted amount of sales (in dollars) is Select one: a. $12,300 b. $123,000 c. $4,875 d. $4,875,000The following data show the amount spent on office-building construction (in thousands) for a particular county during a 6-month period. Office Construction Month Apr May Jun Jul Aug Sep Amount (in thousands) $15 $25 $42 $51 $60 $74 Copy Data Find the least‑squares regression line for the data. (Let x=1 correspond to January, x=2 to February, etc.) Round the coefficients to three decimal places. Estimate the amount spent on construction in October. Express your answer in thousands of dollars and round to three decimal places.
- An agricultural scientist planted alfalfa on several plots of land, identical except for the soil pH. Following are the dry matter yields (in pounds per acre) for each plot. pH 4.6 4.8 5.2 5.4 5.6 5.8 6 Yield 1056 1833 1629 1852 1783 2647 2181 Compute the least-squares line for predicting yield from pH. Round the answers to two decimal places. y = + xThe following data show the amount spent on office-building construction (in thousands) for a particular county during a 66-month period. Office Construction Month Apr May Jun Jul Aug Sep Amount (in thousands) $14 $26 $40 $46 $60 $69 Find the least‑squares regression line for the data. (Let x=1x=1 correspond to January, x=2x=2 to February, etc.) Round the coefficients to three decimal places. Estimate the amount spent on construction in October. Express your answer in thousands of dollars and round to three decimal places.The position of a particle x(t) on an axis has been monitored. The results are shown in the following table. t x(t)0 41 114 129 12 By the least squares method, fit the data to a quadratic model: Report x(10)
