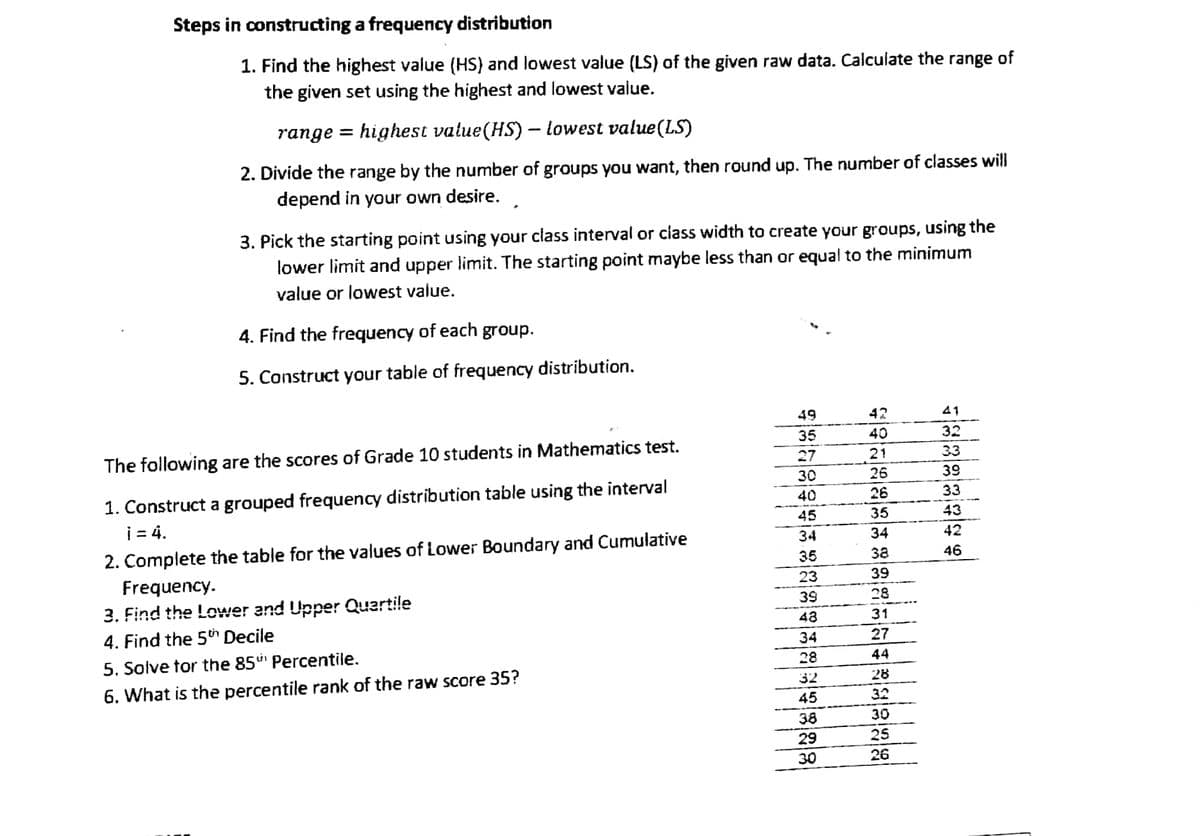
The following are the scores of Grade 10 students in Mathematics test. 1. Construct a grouped frequency distribution table using the interval i = 4. 2. Complete the table for the values of Lower Boundary and Cumulative Frequency. 3. Find the Lower and Upper Quartile 4. Find the 5th Decile 5. Solve for the 85 Percentile. 6. What is the percentile rank of the raw score 35? 49 35 27 30 40 45 34 35 23 39 48 34 28 32 45 38 29 30 42 40 21 26 26 35 34 38 39 28 31 27 44 28 32 30 25 26 -Jalalalalala 41 32 33 39 33 42 46
The following are the scores of Grade 10 students in Mathematics test. 1. Construct a grouped frequency distribution table using the interval i = 4. 2. Complete the table for the values of Lower Boundary and Cumulative Frequency. 3. Find the Lower and Upper Quartile 4. Find the 5th Decile 5. Solve for the 85 Percentile. 6. What is the percentile rank of the raw score 35? 49 35 27 30 40 45 34 35 23 39 48 34 28 32 45 38 29 30 42 40 21 26 26 35 34 38 39 28 31 27 44 28 32 30 25 26 -Jalalalalala 41 32 33 39 33 42 46

Glencoe Algebra 1, Student Edition, 9780079039897, 0079039898, 2018
18th Edition
ISBN:9780079039897
Author:Carter
Publisher:Carter
Chapter10: Statistics
Section: Chapter Questions
Problem 27SGR

Related questions
Question
Transcribed Image Text:Steps in constructing a frequency distribution
of
1. Find the highest value (HS) and lowest value (LS) of the given raw data. Calculate the range
the given set using the highest and lowest value.
range =
highest value(HS) - lowest value(LS)
2. Divide the range by the number of groups you want, then round up. The number of classes will
depend in your own desire.
3. Pick the starting point using your class interval or class width to create your groups, using the
lower limit and upper limit. The starting point maybe less than or equal to the minimum
value or lowest value.
4. Find the frequency of each group.
5. Construct your table of frequency distribution.
49
41
35
32
The following are the scores of Grade 10 students in Mathematics test.
27
33
30
39
40
33
1. Construct a grouped frequency distribution table using the interval
i = 4.
45
43
34
42
46
35
2. Complete the table for the values of Lower Boundary and Cumulative
Frequency.
23
3. Find the Lower and Upper Quartile
39
48
4. Find the 5th Decile
34
5. Solve for the 85 Percentile.
28
6. What is the percentile rank of the raw score 35?
32
45
38
29
30
957
SPRECES 388554
42
40
21
26
26
35
34
39
28
31
27
44
28
32
30
25
26
Expert Solution
This question has been solved!
Explore an expertly crafted, step-by-step solution for a thorough understanding of key concepts.

Step by step
Solved in 4 steps

Recommended textbooks for you
Glencoe Algebra 1, Student Edition, 9780079039897…
Algebra
ISBN:
9780079039897
Author:
Carter
Publisher:
McGraw Hill

Holt Mcdougal Larson Pre-algebra: Student Edition…
Algebra
ISBN:
9780547587776
Author:
HOLT MCDOUGAL
Publisher:
HOLT MCDOUGAL
Glencoe Algebra 1, Student Edition, 9780079039897…
Algebra
ISBN:
9780079039897
Author:
Carter
Publisher:
McGraw Hill
Holt Mcdougal Larson Pre-algebra: Student Edition…
Algebra
ISBN:
9780547587776
Author:
HOLT MCDOUGAL
Publisher:
HOLT MCDOUGAL