The following box plot shows the U.S. population for 1990, the latest available year. 17 33 50 =105 ure 2.42 a. Are there fewer or more children (age 17 and under) than senior citizens (age 65 and over)? How do you know? b. 12.6% are age 65 and over. Approximately what percentage of the population are working age adults (above age 17 to age 65)?
The following box plot shows the U.S. population for 1990, the latest available year. 17 33 50 =105 ure 2.42 a. Are there fewer or more children (age 17 and under) than senior citizens (age 65 and over)? How do you know? b. 12.6% are age 65 and over. Approximately what percentage of the population are working age adults (above age 17 to age 65)?

Chapter4: Linear Functions
Section: Chapter Questions
Problem 29PT: For the following exercises, use Table 4 which shows the percent of unemployed persons 25 years or...

Related questions
Question
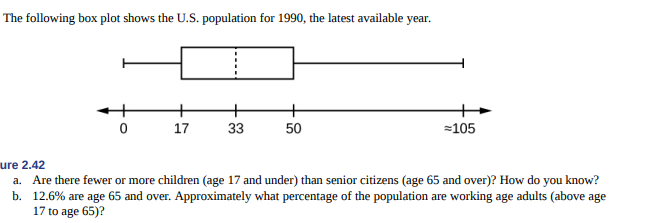
Transcribed Image Text:The following box plot shows the U.S. population for 1990, the latest available year.
+
33
17
50
=105
ure 2.42
a. Are there fewer or more children (age 17 and under) than senior citizens (age 65 and over)? How do you know?
b. 12.6% are age 65 and over. Approximately what percentage of the population are working age adults (above age
17 to age 65)?
Expert Solution
This question has been solved!
Explore an expertly crafted, step-by-step solution for a thorough understanding of key concepts.

This is a popular solution!

Trending now
This is a popular solution!

Step by step
Solved in 2 steps

Recommended textbooks for you

Holt Mcdougal Larson Pre-algebra: Student Edition…
Algebra
ISBN:
9780547587776
Author:
HOLT MCDOUGAL
Publisher:
HOLT MCDOUGAL

Trigonometry (MindTap Course List)
Trigonometry
ISBN:
9781337278461
Author:
Ron Larson
Publisher:
Cengage Learning
Holt Mcdougal Larson Pre-algebra: Student Edition…
Algebra
ISBN:
9780547587776
Author:
HOLT MCDOUGAL
Publisher:
HOLT MCDOUGAL
Trigonometry (MindTap Course List)
Trigonometry
ISBN:
9781337278461
Author:
Ron Larson
Publisher:
Cengage Learning


Algebra for College Students
Algebra
ISBN:
9781285195780
Author:
Jerome E. Kaufmann, Karen L. Schwitters
Publisher:
Cengage Learning

Intermediate Algebra
Algebra
ISBN:
9781285195728
Author:
Jerome E. Kaufmann, Karen L. Schwitters
Publisher:
Cengage Learning