The following table shows the amount of a chemical substance over time. Time (hours) Amount (mg). 37 27 28 32 27 34 26 44 24 25
The following table shows the amount of a chemical substance over time. Time (hours) Amount (mg). 37 27 28 32 27 34 26 44 24 25

Glencoe Algebra 1, Student Edition, 9780079039897, 0079039898, 2018
18th Edition
ISBN:9780079039897
Author:Carter
Publisher:Carter
Chapter4: Equations Of Linear Functions
Section4.6: Regression And Median-fit Lines
Problem 13PPS

Related questions
Question
100%
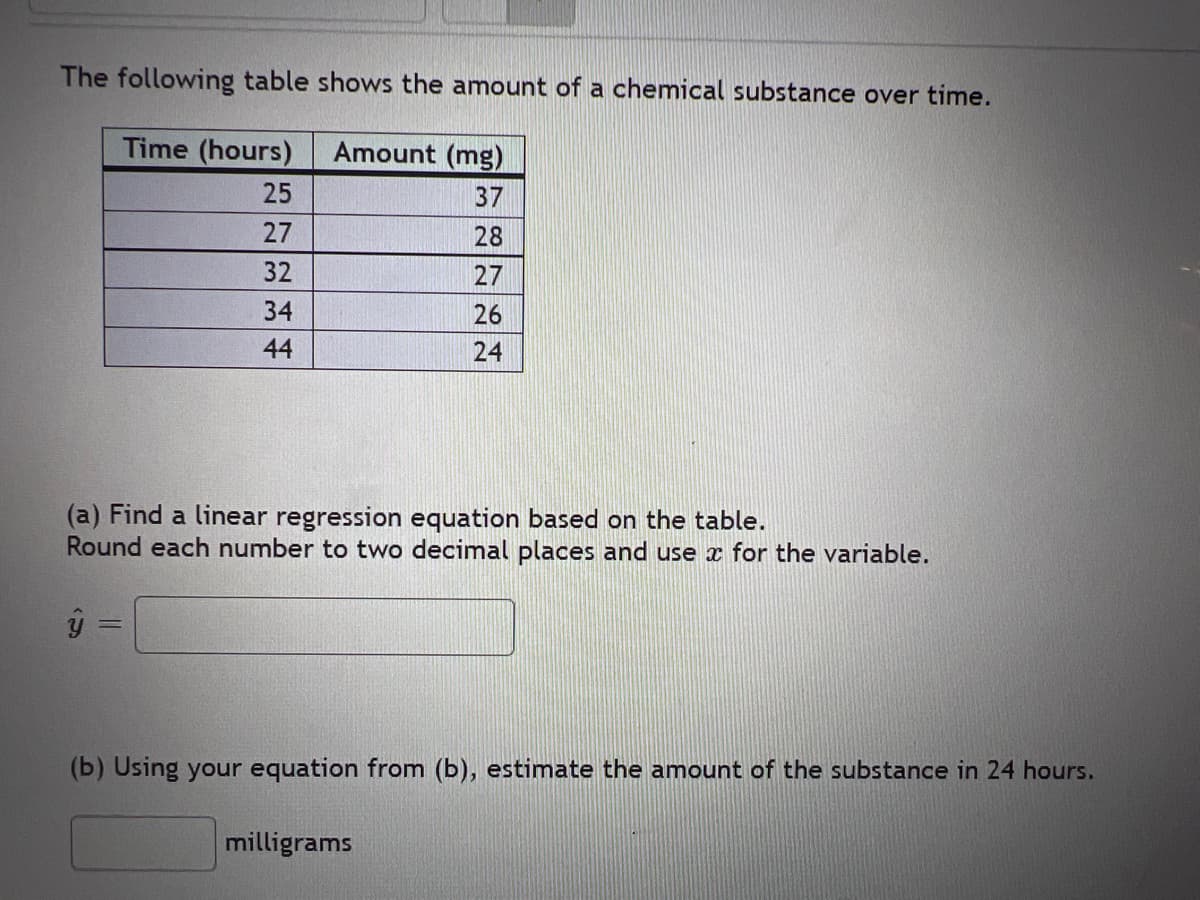
Transcribed Image Text:The following table shows the amount of a chemical substance over time.
Time (hours)
Amount (mg)
25
37
27
28
32
27
34
26
44
24
(a) Find a linear regression equation based on the table.
Round each number to two decimal places and use x for the variable.
(b) Using your equation from (b), estimate the amount of the substance in 24 hours.
milligrams
Expert Solution
This question has been solved!
Explore an expertly crafted, step-by-step solution for a thorough understanding of key concepts.

Step by step
Solved in 2 steps

Recommended textbooks for you
Glencoe Algebra 1, Student Edition, 9780079039897…
Algebra
ISBN:
9780079039897
Author:
Carter
Publisher:
McGraw Hill

Functions and Change: A Modeling Approach to Coll…
Algebra
ISBN:
9781337111348
Author:
Bruce Crauder, Benny Evans, Alan Noell
Publisher:
Cengage Learning

Glencoe Algebra 1, Student Edition, 9780079039897…
Algebra
ISBN:
9780079039897
Author:
Carter
Publisher:
McGraw Hill
Functions and Change: A Modeling Approach to Coll…
Algebra
ISBN:
9781337111348
Author:
Bruce Crauder, Benny Evans, Alan Noell
Publisher:
Cengage Learning

Algebra & Trigonometry with Analytic Geometry
Algebra
ISBN:
9781133382119
Author:
Swokowski
Publisher:
Cengage