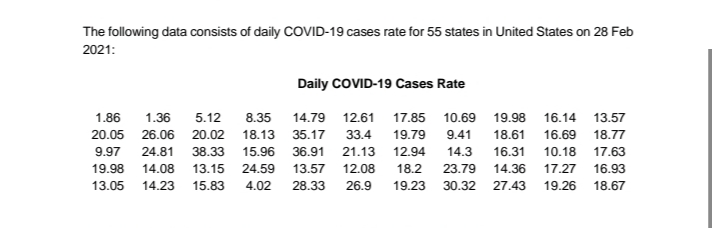
The following data consists of daily COVID-19 cases rate for 55 states in United States on 28 Feb 2021: Daily COVID-19 Cases Rate 1.86 1.36 5.12 8.35 14.79 12.61 17.85 10.69 19.98 16.14 13.57 20.05 26.06 20.02 18.13 35.17 33.4 19.79 9.41 18.61 16.69 18.77 9.97 24.81 38.33 15.96 36.91 21.13 12.94 14.3 16.31 10.18 17.63 19.98 14.08 13.15 24.59 13.57 12.08 18.2 23.79 14.36 17.27 16.93 13.05 14.23 15.83 4.02 28.33 26.9 19.23 30.32 27.43 19.26 18.67
The following data consists of daily COVID-19 cases rate for 55 states in United States on 28 Feb 2021: Daily COVID-19 Cases Rate 1.86 1.36 5.12 8.35 14.79 12.61 17.85 10.69 19.98 16.14 13.57 20.05 26.06 20.02 18.13 35.17 33.4 19.79 9.41 18.61 16.69 18.77 9.97 24.81 38.33 15.96 36.91 21.13 12.94 14.3 16.31 10.18 17.63 19.98 14.08 13.15 24.59 13.57 12.08 18.2 23.79 14.36 17.27 16.93 13.05 14.23 15.83 4.02 28.33 26.9 19.23 30.32 27.43 19.26 18.67

Glencoe Algebra 1, Student Edition, 9780079039897, 0079039898, 2018
18th Edition
ISBN:9780079039897
Author:Carter
Publisher:Carter
Chapter4: Equations Of Linear Functions
Section: Chapter Questions
Problem 8SGR

Related questions
Question
a) obtain the first quartile , third quartile and interquartile average. Intepret the value of Q1 and Q2.
b) Draw the boxplot and interpret the plot.
Transcribed Image Text:The following data consists of daily COVID-19 cases rate for 55 states in United States on 28 Feb
2021:
Daily COVID-19 Cases Rate
1.86
1.36
5.12
8.35
14.79 12.61
17.85
10.69
19.98
16.14 13.57
20.05 26.06
20.02
18.13 35.17
33.4
19.79
9.41
18.61
16.69 18.77
9.97
24.81
38.33
15.96
36.91
21.13
12.94
14.3
16.31
10.18 17.63
19.98
14.08
13.15
24.59
13.57
12.08
18.2
23.79
14.36
17.27
16.93
13.05
14.23
15.83
4.02
28.33
26.9
19.23
30.32
27.43
19.26
18.67
Expert Solution
This question has been solved!
Explore an expertly crafted, step-by-step solution for a thorough understanding of key concepts.

Step by step
Solved in 3 steps with 1 images

Recommended textbooks for you
Glencoe Algebra 1, Student Edition, 9780079039897…
Algebra
ISBN:
9780079039897
Author:
Carter
Publisher:
McGraw Hill
Glencoe Algebra 1, Student Edition, 9780079039897…
Algebra
ISBN:
9780079039897
Author:
Carter
Publisher:
McGraw Hill