The following data gave X = the water content of snow on April 1 and Y = the yield from April to July (in inches) on the Snake River watershed in Wyoming for 1919 to 1935. (The data were taken from an article in Research Notes,Vol. 61, 1950, Pacific Northwest Forest Range Experiment Station, Oregon). 23.1 32.8 31.8 32.0 30.4 24.0 39.5 24.2 52.5 37.9 30.5 25.1 12.4 35.1 31.5 21.1 27.6 y 10.5 16.7 18.2 17.0 16.3 10.5 23.1 12.4 24.9 22.8 14.1 12.9 8.8 17.4 14.9 10.5 16.1 (a) Estimate the correlation between Y and X. Round your answer to 3 decimal places. (b) Test the hypothesis that Ho: p = 0 against H|:p # 0 with a = 0.10. Statistical Tables and Charts Reject the null hypothesis. Do not reject the null hypothesis.
The following data gave X = the water content of snow on April 1 and Y = the yield from April to July (in inches) on the Snake River watershed in Wyoming for 1919 to 1935. (The data were taken from an article in Research Notes,Vol. 61, 1950, Pacific Northwest Forest Range Experiment Station, Oregon). 23.1 32.8 31.8 32.0 30.4 24.0 39.5 24.2 52.5 37.9 30.5 25.1 12.4 35.1 31.5 21.1 27.6 y 10.5 16.7 18.2 17.0 16.3 10.5 23.1 12.4 24.9 22.8 14.1 12.9 8.8 17.4 14.9 10.5 16.1 (a) Estimate the correlation between Y and X. Round your answer to 3 decimal places. (b) Test the hypothesis that Ho: p = 0 against H|:p # 0 with a = 0.10. Statistical Tables and Charts Reject the null hypothesis. Do not reject the null hypothesis.

Chapter4: Linear Functions
Section: Chapter Questions
Problem 41RE: For the following exercises, consider the data in Table 5, which shows the percent of unemployed in...

Related questions
Question
8
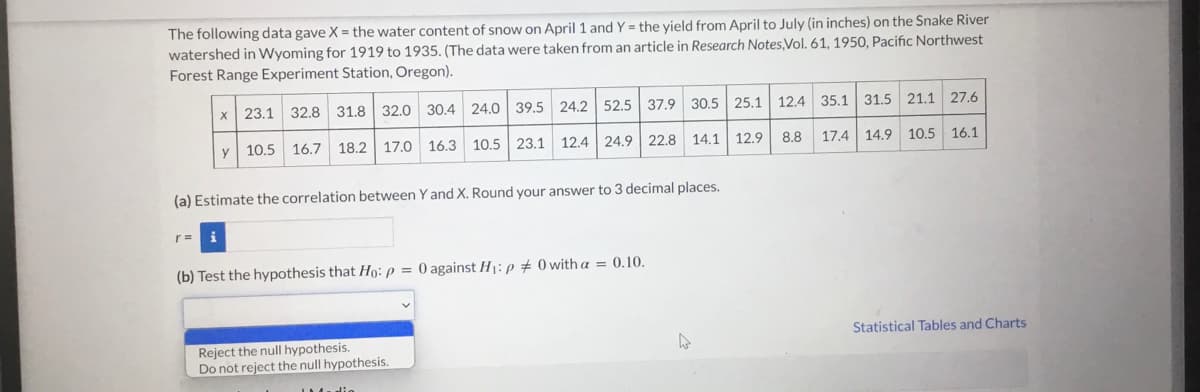
Transcribed Image Text:The following data gave X = the water content of snow on April 1 and Y = the yield from April to July (in inches) on the Snake River
watershed in Wyoming for 1919 to 1935. (The data were taken from an article in Research Notes,Vol. 61, 1950, Pacific Northwest
Forest Range Experiment Station, Oregon).
x 23.1 32.8 31.8 32.0 30.4 24.0 39.5 24.2 52.5 37.9 30.5 25.1 12.4 35.1 31.5 21.1 27.6
y 10.5
16.7 18.2
17.0 16.3 10.5 23.1
12.4 24.9 22.8 14.1 12.9
8.8
17.4 14.9 10.5 16.1
(a) Estimate the correlation between Y and X. Round your answer to 3 decimal places.
r =
(b) Test the hypothesis that Ho: p = 0 against H1: p # 0 with a = 0.10.
Statistical Tables and Charts
Reject the null hypothesis.
Do not reject the null hypothesis.
Expert Solution
This question has been solved!
Explore an expertly crafted, step-by-step solution for a thorough understanding of key concepts.

This is a popular solution!

Trending now
This is a popular solution!

Step by step
Solved in 2 steps with 2 images

Recommended textbooks for you

Glencoe Algebra 1, Student Edition, 9780079039897…
Algebra
ISBN:
9780079039897
Author:
Carter
Publisher:
McGraw Hill

Functions and Change: A Modeling Approach to Coll…
Algebra
ISBN:
9781337111348
Author:
Bruce Crauder, Benny Evans, Alan Noell
Publisher:
Cengage Learning
Glencoe Algebra 1, Student Edition, 9780079039897…
Algebra
ISBN:
9780079039897
Author:
Carter
Publisher:
McGraw Hill
Functions and Change: A Modeling Approach to Coll…
Algebra
ISBN:
9781337111348
Author:
Bruce Crauder, Benny Evans, Alan Noell
Publisher:
Cengage Learning