The following data represent the grades of 50 students in the Statistics course, place these data in the form of a frequency table, considering the first category on the picture (56-50), the length of the 6 class and the last category (92-98), then calculate: 1- The angle opposite each category 2- Find the mean The 50th percentile and mode 3 - mean and standard deviation, variance and coefficient of variation


Inverse Normal Distribution
The method used for finding the corresponding z-critical value in a normal distribution using the known probability is said to be an inverse normal distribution. The inverse normal distribution is a continuous probability distribution with a family of two parameters.
Mean, Median, Mode
It is a descriptive summary of a data set. It can be defined by using some of the measures. The central tendencies do not provide information regarding individual data from the dataset. However, they give a summary of the data set. The central tendency or measure of central tendency is a central or typical value for a probability distribution.
Z-Scores
A z-score is a unit of measurement used in statistics to describe the position of a raw score in terms of its distance from the mean, measured with reference to standard deviation from the mean. Z-scores are useful in statistics because they allow comparison between two scores that belong to different normal distributions.
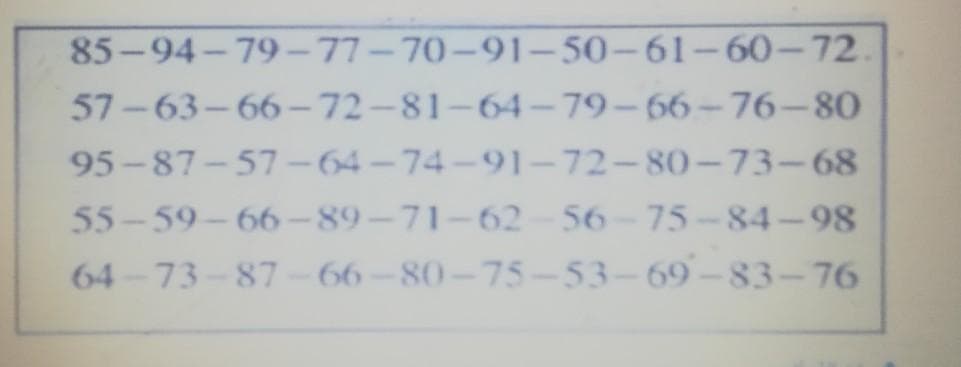
The following data represent the grades of 50 students in the Statistics course, place these data in the form of a frequency table, considering the first category on the picture (56-50), the length of the 6 class and the last category (92-98), then calculate:
1- The angle opposite each category
2- Find the mean The 50th percentile and
3 - mean and standard deviation, variance and coefficient of variation

Step by step
Solved in 2 steps with 1 images


