The following data represent the high-temperature distribution for a summer month in a city for some of the last 130 years. Treat the data as a population. Complete parts (a) through (c). Temperature (°F) 50-59 60-69 70-79 80-89 90-99 100-109 Days 302 1483 1525 548 10 (a) Approximate the mean and standard deviation for temperature. u=°F (Round to one decimal place as needed.) °F (Round to one decimal place as needed.) (b) Draw a frequency histogram of the data to verify that the distribution is bell shaped. Construct a frequency histogram. Choose the correct graph below. OD. OB. OC. O A. AFrequency AFrequency 17504 AFrequency 1750 1750- Frequency 1750
The following data represent the high-temperature distribution for a summer month in a city for some of the last 130 years. Treat the data as a population. Complete parts (a) through (c). Temperature (°F) 50-59 60-69 70-79 80-89 90-99 100-109 Days 302 1483 1525 548 10 (a) Approximate the mean and standard deviation for temperature. u=°F (Round to one decimal place as needed.) °F (Round to one decimal place as needed.) (b) Draw a frequency histogram of the data to verify that the distribution is bell shaped. Construct a frequency histogram. Choose the correct graph below. OD. OB. OC. O A. AFrequency AFrequency 17504 AFrequency 1750 1750- Frequency 1750

Glencoe Algebra 1, Student Edition, 9780079039897, 0079039898, 2018
18th Edition
ISBN:9780079039897
Author:Carter
Publisher:Carter
Chapter10: Statistics
Section10.4: Distributions Of Data
Problem 19PFA

Related questions
Topic Video
Question
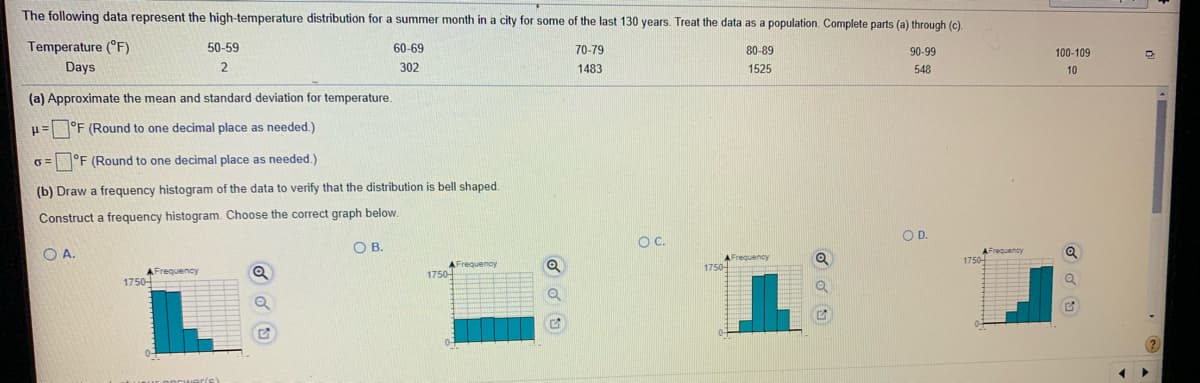
Transcribed Image Text:The following data represent the high-temperature distribution for a summer month in a city for some of the last 130 years. Treat the data as a population. Complete parts (a) through (c).
Temperature (°F)
50-59
60-69
70-79
80-89
90-99
100-109
Days
2
302
1483
1525
548
10
(a) Approximate the mean and standard deviation for temperature.
H= °F (Round to one decimal place as needed.)
o =°F (Round to one decimal place as needed.)
(b) Draw a frequency histogram of the data to verify that the distribution is bell shaped.
Construct a frequency histogram. Choose the correct graph below.
OB.
C.
OD.
O A.
AFrequency
1750-
AFrequency
17504
1750-
Expert Solution
This question has been solved!
Explore an expertly crafted, step-by-step solution for a thorough understanding of key concepts.

This is a popular solution!

Trending now
This is a popular solution!

Step by step
Solved in 4 steps with 1 images

Knowledge Booster


Learn more about
Need a deep-dive on the concept behind this application? Look no further. Learn more about this topic, statistics and related others by exploring similar questions and additional content below.Recommended textbooks for you
Glencoe Algebra 1, Student Edition, 9780079039897…
Algebra
ISBN:
9780079039897
Author:
Carter
Publisher:
McGraw Hill
Glencoe Algebra 1, Student Edition, 9780079039897…
Algebra
ISBN:
9780079039897
Author:
Carter
Publisher:
McGraw Hill