The following data represent the pH of rain for a random sample of 12 rain dates. A normal probability plot suggests the data could come from a population that is normally distributed. A boxplot indicates there are no outliers. Complete parts a) through d) below. Click the icon to view the table of critical t-values. (a) Determine a point estimate for the population mean. A point estimate for the population mean is 5.00 (Round to two decimal places as needed.) 5.05 5.02 5.29 5.72 4.59 4.76 4.62 4.74 4.56 (b) Construct and interpret a 95% confidence interval for the mean pH of rainwater. Select the correct choice below and fill in the answer boxes to complete your choice. (Use ascending order. Round to two decimal places as needed.) OA. If repeated samples are taken, 95% of them will have a sample pH of rain water between and OB. There is 95% confidence that the population mean pH of rain water is between and OC. There is a 95% probability that the true mean pH of rain water is between and 4.80 5.19 5.68
The following data represent the pH of rain for a random sample of 12 rain dates. A normal probability plot suggests the data could come from a population that is normally distributed. A boxplot indicates there are no outliers. Complete parts a) through d) below. Click the icon to view the table of critical t-values. (a) Determine a point estimate for the population mean. A point estimate for the population mean is 5.00 (Round to two decimal places as needed.) 5.05 5.02 5.29 5.72 4.59 4.76 4.62 4.74 4.56 (b) Construct and interpret a 95% confidence interval for the mean pH of rainwater. Select the correct choice below and fill in the answer boxes to complete your choice. (Use ascending order. Round to two decimal places as needed.) OA. If repeated samples are taken, 95% of them will have a sample pH of rain water between and OB. There is 95% confidence that the population mean pH of rain water is between and OC. There is a 95% probability that the true mean pH of rain water is between and 4.80 5.19 5.68

Glencoe Algebra 1, Student Edition, 9780079039897, 0079039898, 2018
18th Edition
ISBN:9780079039897
Author:Carter
Publisher:Carter
Chapter10: Statistics
Section10.4: Distributions Of Data
Problem 19PFA

Related questions
Question
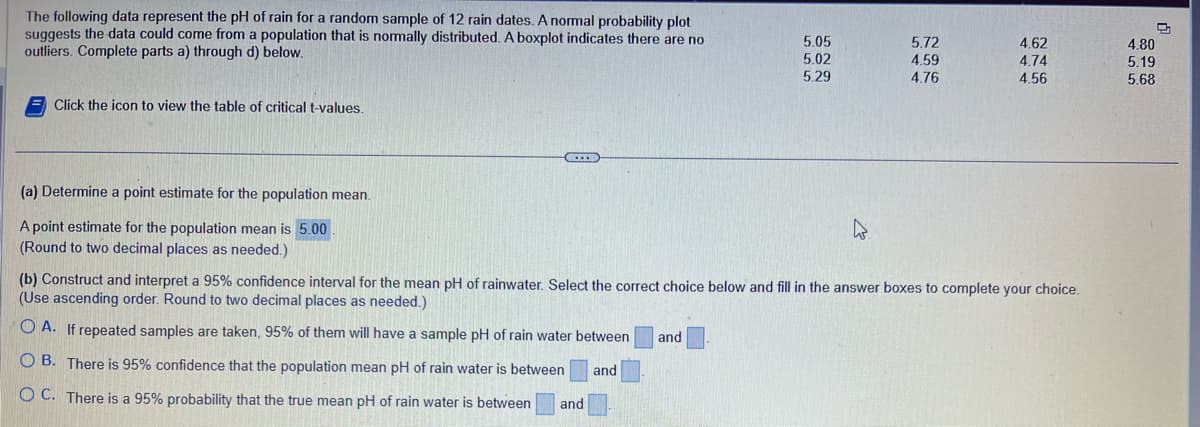
Transcribed Image Text:The following data represent the pH of rain for a random sample of 12 rain dates. A normal probability plot
suggests the data could come from a population that is normally distributed. A boxplot indicates there are no
outliers. Complete parts a) through d) below.
Click the icon to view the table of critical t-values.
(a) Determine a point estimate for the population mean.
A point estimate for the population mean is 5.00
(Round to two decimal places as needed.)
5.05
5.02
5.29
and
5.72
4.59
4.76
4.62
4.74
4.56
(b) Construct and interpret a 95% confidence interval for the mean pH of rainwater. Select the correct choice below and fill in the answer boxes to complete your choice.
(Use ascending order. Round to two decimal places as needed.)
OA. If repeated samples are taken, 95% of them will have a sample pH of rain water between and
OB. There is 95% confidence that the population mean pH of rain water is between and
OC. There is a 95% probability that the true mean pH of rain water is between
4.80
5.19
5.68
Expert Solution
This question has been solved!
Explore an expertly crafted, step-by-step solution for a thorough understanding of key concepts.

This is a popular solution!

Trending now
This is a popular solution!

Step by step
Solved in 2 steps with 3 images

Recommended textbooks for you
Glencoe Algebra 1, Student Edition, 9780079039897…
Algebra
ISBN:
9780079039897
Author:
Carter
Publisher:
McGraw Hill
Glencoe Algebra 1, Student Edition, 9780079039897…
Algebra
ISBN:
9780079039897
Author:
Carter
Publisher:
McGraw Hill