The following data represent the pH of rain for a random sample of rain dates. A normal probability plot suggests the data could come from a population that is normally distributed Aboxplot indicates there are no outlers. Complete parts a) through d) below Click the icon to view the table of critical t-values (a) Determine a point estimate for the population mean A point estimate for the population mean is Round to two decimal places as needed) b) Construct and interpret a 95% confidence interval for the mean pH of rainwater. Select the correct choice below and fill in the answer boxes to complete your choice. Use ascending order Round to two decimal places as needed.) OA. There is a 95% probability that the true mean pH of rain water is between and OB. There is 95% confidence that the population mean pH of rain water is between and OC. If repeated samples are taken, 95% of them will have a sample pH of rain water between and c) Construct and interpret a 99% confidence interval for the mean pH of rainwater. Select the correct choice below and fill in the answer boxes to complete your choice Use ascending order Round to two decimal places as needed) OA. There is 99% confidence that the population mean pH of rain water is between and OB. If repeated samples are taken, 99% of them will have a sample pH of rain water between and OC. There is a 99% probability that the true mean pH of rain water is between and (d) What happens to the intervall as the level of confidence is changed? Explain why this is a logical result This makes sense since the As the level of confidence increases the width of the interval [ A A Table of Critical t-Values A Degrees of Freedom 8.25 0.20 0.20 0.15 9.19 11 12 9180 0.400 0.02 0.025 1000 1376 1963 3.0786314 12.706 15.04 LOGE 1886 2100 4.303 4.500 0.005 0.0025 32 34T 122321 318309636.49 9925 14.000 22.327 31.500 0765 0978 1638 2389 3.182 3,412 4.541 5841 7453 10.215 12:904 0741 1190 1533 2132 2.776 2999 3747 4.604 5.506 2173 KALO 0727 0.930 1156 1476 2015 2571 2757 3365 4032 4.773 5309 0718 4.906 1134 1440 3.143 3.707 4317 538 4711 111 1415 LIS 4.009 4785 5.406 296 3355 3833 4.500 500 47 4.567 1860 2306 1833 1812 2447 2612 2.87 2.30 2359 2821 3266 0706 03000 1108 1347 0.708 083 1100 1.343 0.700 0879 100 1372 0.407 08761088 1363 08731003 1356 1350 1.77 1345 1.768 1074 1341 1.753 1.796 0.404 0570 1079 0402 0868 10% 0401 ORVO 04 1990 DIVO DVD OLOT 1337 1.346 1333 1.340 1330 1734 2.100 1338 1.729 2005 09060 1064 1325 1.725 0.859 1323 17 1321 1.717 0.858 1.303 0.858 LOND 1319 GAST 1315 1711 0.856 1058 1306 1.308 0644 0.856 L 1345 GAN BASS 1314 0683 0895 1056 1343 1.301 2048 2154 0854 LOS 1311 1009 0.683 0854 1300 LAAT 0.482 0853 1054 1309 0853 1054 1309 0.482 0853 1053 0682 0852 1062 1.300 0852 INVO 0680 0852 0851 890 HOTEWO 1960 0677 WIT 9950 9901 1901 6901 1901 9901 11 048 0851 0681 0851 1050 0481 0851 L050 1308 0479 1047 1299 1676 0679 0848 1045 1296 1671 6.347 1044 1294 1043 1242 10402 1291 0677 0.545 0675 0842 0624 6.842 1036 -Distribution Area in LOC DET Degrees of $.25 6.29 0.15 6.19 Freedom 1304 1304 Lead 5.58 5.02 5.34 1991 1645 www Print Tal 1714 2009 2177 2.500 2064 2372 2004 2000 1990 stere Distributi 3581 2.308 2718 3.106 3.407 4005 4437 2303 2601 3.095 3.428 3:900 2212 3787 2309 2602 2947 HOTE 2056 2062 lee 2:235 2.583 2921 2567 2552 2000 2199 2518 281 258 2007 2141 2035 2136 2000 2133 2214 2305 2539 2861 2.397 2.538 cer's 2450 3012 3372 2624 2977 3336 3252 2479 2779 2158 2475 2771 2009 2000 2015 2150 2147 2457 2750 2144 2453 2744 2449 2738 2445 2733 2441 2728 2724 2797 2787 2467 2763 2462 5.72 4.59 4.76 Done sore sore 3.135 3.129 3.304 3000 3.222 3646 3:965 3600 3.134 3.159 2131 2434 2719 2129 2430 2715 2985 2429 2960 2125 2406 2708 2423 2704 1917 3067 3.435 3057 3047 2.996 3.000 3345 3022 3015 3365 3329 3768 240 2478 2987 3:361 2390 2600 2915 2.381 2648 2.899 3.600 3633 3.356 3611 3601 3340 3.500 3339 3309 3.566 2976 3313 3.908 2971 3307 3.591 3.460 3435 3.196 3.416 2632 2876 3.183 3.412 3.008 2,364 2636 2371 3174 3390 2330 2576 3.000 3291 GLC GLE 0.005 0.0025 0.0005 0.0025 n X 4.99 4.74 4.56 480 5.19 5.71
The following data represent the pH of rain for a random sample of rain dates. A normal probability plot suggests the data could come from a population that is normally distributed Aboxplot indicates there are no outlers. Complete parts a) through d) below Click the icon to view the table of critical t-values (a) Determine a point estimate for the population mean A point estimate for the population mean is Round to two decimal places as needed) b) Construct and interpret a 95% confidence interval for the mean pH of rainwater. Select the correct choice below and fill in the answer boxes to complete your choice. Use ascending order Round to two decimal places as needed.) OA. There is a 95% probability that the true mean pH of rain water is between and OB. There is 95% confidence that the population mean pH of rain water is between and OC. If repeated samples are taken, 95% of them will have a sample pH of rain water between and c) Construct and interpret a 99% confidence interval for the mean pH of rainwater. Select the correct choice below and fill in the answer boxes to complete your choice Use ascending order Round to two decimal places as needed) OA. There is 99% confidence that the population mean pH of rain water is between and OB. If repeated samples are taken, 99% of them will have a sample pH of rain water between and OC. There is a 99% probability that the true mean pH of rain water is between and (d) What happens to the intervall as the level of confidence is changed? Explain why this is a logical result This makes sense since the As the level of confidence increases the width of the interval [ A A Table of Critical t-Values A Degrees of Freedom 8.25 0.20 0.20 0.15 9.19 11 12 9180 0.400 0.02 0.025 1000 1376 1963 3.0786314 12.706 15.04 LOGE 1886 2100 4.303 4.500 0.005 0.0025 32 34T 122321 318309636.49 9925 14.000 22.327 31.500 0765 0978 1638 2389 3.182 3,412 4.541 5841 7453 10.215 12:904 0741 1190 1533 2132 2.776 2999 3747 4.604 5.506 2173 KALO 0727 0.930 1156 1476 2015 2571 2757 3365 4032 4.773 5309 0718 4.906 1134 1440 3.143 3.707 4317 538 4711 111 1415 LIS 4.009 4785 5.406 296 3355 3833 4.500 500 47 4.567 1860 2306 1833 1812 2447 2612 2.87 2.30 2359 2821 3266 0706 03000 1108 1347 0.708 083 1100 1.343 0.700 0879 100 1372 0.407 08761088 1363 08731003 1356 1350 1.77 1345 1.768 1074 1341 1.753 1.796 0.404 0570 1079 0402 0868 10% 0401 ORVO 04 1990 DIVO DVD OLOT 1337 1.346 1333 1.340 1330 1734 2.100 1338 1.729 2005 09060 1064 1325 1.725 0.859 1323 17 1321 1.717 0.858 1.303 0.858 LOND 1319 GAST 1315 1711 0.856 1058 1306 1.308 0644 0.856 L 1345 GAN BASS 1314 0683 0895 1056 1343 1.301 2048 2154 0854 LOS 1311 1009 0.683 0854 1300 LAAT 0.482 0853 1054 1309 0853 1054 1309 0.482 0853 1053 0682 0852 1062 1.300 0852 INVO 0680 0852 0851 890 HOTEWO 1960 0677 WIT 9950 9901 1901 6901 1901 9901 11 048 0851 0681 0851 1050 0481 0851 L050 1308 0479 1047 1299 1676 0679 0848 1045 1296 1671 6.347 1044 1294 1043 1242 10402 1291 0677 0.545 0675 0842 0624 6.842 1036 -Distribution Area in LOC DET Degrees of $.25 6.29 0.15 6.19 Freedom 1304 1304 Lead 5.58 5.02 5.34 1991 1645 www Print Tal 1714 2009 2177 2.500 2064 2372 2004 2000 1990 stere Distributi 3581 2.308 2718 3.106 3.407 4005 4437 2303 2601 3.095 3.428 3:900 2212 3787 2309 2602 2947 HOTE 2056 2062 lee 2:235 2.583 2921 2567 2552 2000 2199 2518 281 258 2007 2141 2035 2136 2000 2133 2214 2305 2539 2861 2.397 2.538 cer's 2450 3012 3372 2624 2977 3336 3252 2479 2779 2158 2475 2771 2009 2000 2015 2150 2147 2457 2750 2144 2453 2744 2449 2738 2445 2733 2441 2728 2724 2797 2787 2467 2763 2462 5.72 4.59 4.76 Done sore sore 3.135 3.129 3.304 3000 3.222 3646 3:965 3600 3.134 3.159 2131 2434 2719 2129 2430 2715 2985 2429 2960 2125 2406 2708 2423 2704 1917 3067 3.435 3057 3047 2.996 3.000 3345 3022 3015 3365 3329 3768 240 2478 2987 3:361 2390 2600 2915 2.381 2648 2.899 3.600 3633 3.356 3611 3601 3340 3.500 3339 3309 3.566 2976 3313 3.908 2971 3307 3.591 3.460 3435 3.196 3.416 2632 2876 3.183 3.412 3.008 2,364 2636 2371 3174 3390 2330 2576 3.000 3291 GLC GLE 0.005 0.0025 0.0005 0.0025 n X 4.99 4.74 4.56 480 5.19 5.71

Glencoe Algebra 1, Student Edition, 9780079039897, 0079039898, 2018
18th Edition
ISBN:9780079039897
Author:Carter
Publisher:Carter
Chapter10: Statistics
Section10.4: Distributions Of Data
Problem 19PFA

Related questions
Question
Help me please
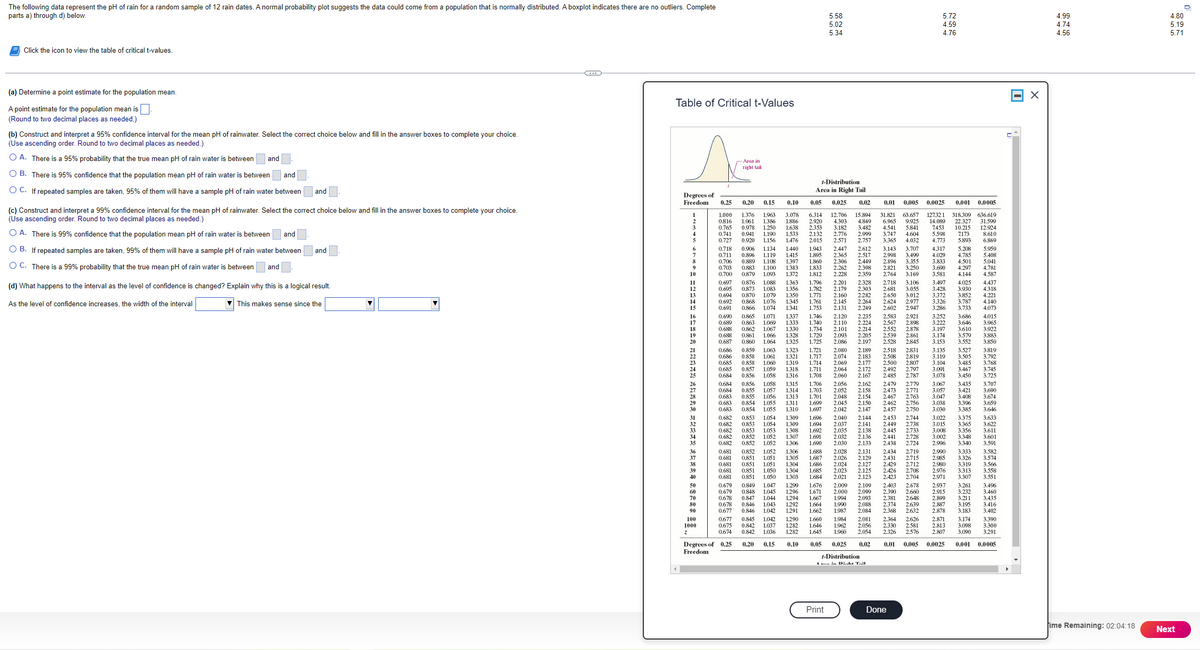
Transcribed Image Text:The following data represent the pH of rain for a random sample of 12 rain dates. A normal probability plot suggests the data could come from a population that is normally distributed. A boxplot indicates there are no outliers. Complete
parts a) through d) below.
Click the icon to view the table of critical t-values.
(a) Determine a point estimate for the population mean.
A point estimate for the population mean is
(Round to two decimal places as needed.)
(b) Construct and interpret a 95% confidence interval for the mean pH of rainwater. Select the correct choice below and fill in the answer boxes to complete your choice.
(Use ascending order. Round to two decimal places as needed.)
O A. There is a 95% probability that the true mean pH of rain water is between and
O B. There is 95% confidence that the population mean pH of rain water is between and
O C. If repeated samples are taken, 95% of them will have a sample pH of rain water between and
(c) Construct and interpret a 99% confidence interval for the mean pH of rainwater. Select the correct choice below and fill in the answer boxes to complete your choice.
(Use ascending order. Round to two decimal places as needed.)
O A. There is 99% confidence that the population mean pH of rain water is between and
OB. If repeated samples are taken, 99% of them will have a sample pH of rain water between and
O C. There is a 99% probability that the true mean pH of rain water is between and
(d) What happens to the interval as the level of confidence is changed? Explain why this is a logical result.
As the level of confidence increases, the width of the interval
This makes sense since the
Table of Critical t-Values
Degrees of
Freedom 0.25
3
4
5
CHEGA HARAK B2928 58830 86888 =2832368A* ***** 31
6
7
8
9
10
11
12
13
14
15
16
17
18
19
20
22
23
28
29
30
31
34
35
37
39
40
50
60
70
80
90
100
1000
z
Area in
right tail
Degrees of 0.25
Freedom
t-Distribution
Area in Right Tail
0.20 0.15
0.10
0.05 0.025 0.02
0.005 0.0025
6.314 12.706 15.894
2.920 4.303 4,849
8.610
6.869
0.001 0.0005
318.309 636.619
14.089 22.327 31.599
7453 10.215 12.924
5.598 7173
4.773 5.893
5.208
4.317
4.029 4.785
3.833 4.501
3.690 4.297
3.581 4.144
3.497 4.025
2.110 2.224
0.685
1.000 1.376 1.963 3.078
31.821 63.657 127.321
0.816 1.061 1.386 1.886
6.965 9.925
0.765 0.978 1.250 1.638 2.353 3.182 3.482 4.541 5.841
0.741 0.941 1.190 1.533 2.132 2.776 2.999 3.747 4.604
0.727 0.920 1.156 1.476 2.015 2.571 2.757 3.365 4.032
0.718
1.134
0.906
1.440 1.943 2.447
3.143
2.612
3.707
0.711 0.896 1.119 1.415 1.895 2.365 2.517 2.998 3.499
0.706 0.889 1.108 1.397 1.860 2.306 2,449 2.896 3.355
0.703 0.883 1.100 1.383 1.833 2.262 2.398 2.821 3.250
0.700 0.879 1.093 1.372 1.812 2.228 2.359 2.764 3.169
0.697 0.876 1.088 1.363 1.796 2.201 2.328 2.718 3.106
0.695 0.873 1.083 1.356 1.782 2.179 2.303 2.681 3.055 3.428 3.930
0.694 0.870 1.079 1.350 1.771 2.160 2.282 2.650 3.012 3.372 3.852
0.692 0.868 1.076 1.345 1.761 2.145 2,264 2.624 2.977 3.326 3.787
0.691 0.866 1.074 1.341 1.753 2.131 2.249 2.602 2.947 3.286 3.733
0.690 0.865 1.071 1.337 1.746 2.120 2.235 2.583 2.921
0.689 0.863 1.069 1.333 1.740
2.567 2.898
0.688 0.862 1.067 1.330 1.734 2.101 2.214 2.552 2.878
0.688 0.861 1.066 1.328 1.729 2.093 2.205 2.539 2.861
0.687 0.860 1.064 1.325 1.725 2.086 2.197 2.528 2.845
0.686 0.859 1.063 1.323 1.721 2.080 2.189 2.518 2.831
0.686 0.858 1.061 1.321 1.717 2.074 2.183 2.508 2.819
0.858 1.060 1.319 1.714 2,069 2.177 2.500 2.807
0.685 0.857 1.059 1.318 1.711 2.064 2.172 2.492 2.797
0.684 0.856 1.058 1.316 1.708 2.060 2.167 2.485 2.787
0.684 0.856 1.058 1.315 1.706 2.056 2.162 2.479 2.779 3.067 3.435
0.684 0.855 1.057 1.314 1.703 2.052 2.158 2.473 2.771 3.057 3.421
0.683 0.855 1.056 1.313 1.701 2.048 2.154 2.467 2.763 3,047 3.408
0.683 0.854 1.055 1.311 1.699 2.045 2.150 2.462 2.756 3.038 3.396
0.683 0.854 1.055 1.310 1.697 2.042 2.147 2,457 2.750 3.030 3.385
0.682 0.853 1.054 1.309 1.696 2,040 2.144 2,453 2.744 3.022 3.375
0.682 0.853 1.054 1.309 1.694 2,037 2.141 2.449 2.738 3.015 3.365
0.682 0.853 1.053 1.308 1.692 2.035 2.138 2.445 2.733 3.008 3.356
0.682 0.852 1.052 1.307 1.691 2.032 2.136 2.441 2.728
3.348
0.682 0.852 1.052 1.306 1.690 2.030 2.133 2.438 2.724 2.996 3.340
0.681 0.852 1.052 1.306 1.688 2.028 2.131 2.434 2.719 2.990 3.333
0.681 0.851 1.051 1.305 1.687 2.026 2.129 2.431 2.715 2.985 3.326
0.681 0.851 1.051 1.304 1.686 2.024 2.127 2.429 2.712 2.980 3.319
0.681 0.851 1.050 1.304 1.685 2.023 2.125 2.426 2.708 2.976 3.313
0.681 0.851 1.050 1.303 1.684 2.021 2.123 2.423 2.704 2.971 3.307
0.679 0,849 1.047 1.299 1.676 2.009 2.109 2.403 2.678 2.937 3.261
0.679 0.848 1.045 1.296 1.671 2.000 2.099 2.390 2.660 2.915 3.232
0.678 0.847 1.044 1.294 1.667 1.994 2.093 2.381 2.648
3.435
0.678 0.846 1.043 1.292 1.664 1.990 2.088 2.374 2.639
3.416
0.677 0.846 1.042 1291 1.662 1.987 2,084 2.368 2.632
3.402
0.677 0.845 1.042 1.290 1.660 1.984 2.081 2.364 2.626 2.871 3.174 3.390
0.675 0.842 1.037 1.282 1.646 1.962 2.056 2.330 2.581 2.813 3.098 3.300
0.674 0.842 1.036 1.282 1.645 1.960 2,054 2.326 2.576 2.807 3.090 3.291
0.20 0.15 0.10 0.05 0.025 0.02
3.002
3.496
3.460
2,899 3.211
2.887 3.195
2.878 3.183
0.01 0.005 0.0025 0.001 0.0005
5.58
5.02
5.34
t-Distribution
A man in Dinkt Tail
Print
0.01
5.72
4.59
4.76
Done
3.252 3.686
3.222 3.646
3.197 3.610
3.174 3.579
3.153 3.552
3.135 3.527
3.119 3.505
3.104 3.485
3.091 3.467
3.078 3.450
5.959
5.408
5.041
4.781
4.587
4.437
4.318
4.221
4.140
4.073
4.015
3.965
3.922
3.883
3.850
3.819
3.792
3.768
3.745
3.725
3.707
3.690
3.674
3.659
3.646
3.633
3.622
3.611
3.601
3.591
3.582
3.574
3.566
3.558
3.551
0
X
4.99
4.74
4.56
ime Remaining: 02:04:18
D
4.80
5.19
5.71
Next
Expert Solution
This question has been solved!
Explore an expertly crafted, step-by-step solution for a thorough understanding of key concepts.

This is a popular solution!

Trending now
This is a popular solution!

Step by step
Solved in 7 steps with 2 images

Recommended textbooks for you
Glencoe Algebra 1, Student Edition, 9780079039897…
Algebra
ISBN:
9780079039897
Author:
Carter
Publisher:
McGraw Hill
Glencoe Algebra 1, Student Edition, 9780079039897…
Algebra
ISBN:
9780079039897
Author:
Carter
Publisher:
McGraw Hill