The following data represent the score of 72 students in an exam. Construct the frequency distribution table and then :answer the question 55 65 40 60 73 56 82 48 69 35 45 84 59 42 23 65 89 79 65 82 37 87 61 55 72 50 22 78 66 51 25 86 77 33 92 84 43 21 62 90 48 66 91 67 38 70 53 77 33 83 57 25 78 52 49 39 80 64 27 90 66 34 92 68 76 47 73 60 42 91 50 60 6. The mode of the data according to frequency distribution table is: 7. The mean deviation of the data according to frequency distribution table is: 8. The standard deviation of the data according to frequency distribution table is:
The following data represent the score of 72 students in an exam. Construct the frequency distribution table and then :answer the question 55 65 40 60 73 56 82 48 69 35 45 84 59 42 23 65 89 79 65 82 37 87 61 55 72 50 22 78 66 51 25 86 77 33 92 84 43 21 62 90 48 66 91 67 38 70 53 77 33 83 57 25 78 52 49 39 80 64 27 90 66 34 92 68 76 47 73 60 42 91 50 60 6. The mode of the data according to frequency distribution table is: 7. The mean deviation of the data according to frequency distribution table is: 8. The standard deviation of the data according to frequency distribution table is:

Glencoe Algebra 1, Student Edition, 9780079039897, 0079039898, 2018
18th Edition
ISBN:9780079039897
Author:Carter
Publisher:Carter
Chapter10: Statistics
Section10.4: Distributions Of Data
Problem 19PFA

Related questions
Question
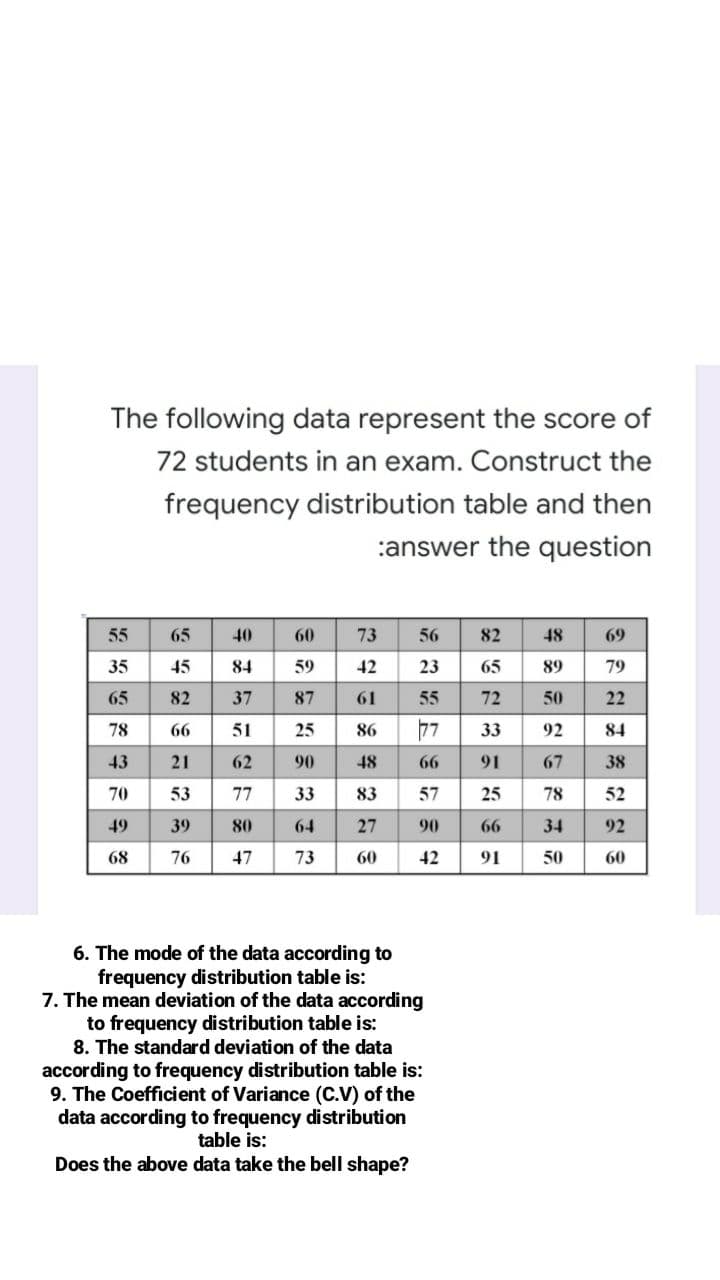
Transcribed Image Text:The following data represent the score of
72 students in an exam. Construct the
frequency distribution table and then
:answer the question
55
65
40
60
73
56
82
48
69
35
45
84
59
42
23
65
89
79
65
82
37
87
61
55
72
50
22
78
66
51
25
86
77
33
92
84
43
21
62
90
48
66
91
67
38
70
53
77
33
83
57
25
78
52
49
39
80
64
27
90
66
34
92
68
76
47
73
60
42
91
50
60
6. The mode of the data according to
frequency distribution table is:
7. The mean deviation of the data according
to frequency distribution table is:
8. The standard deviation of the data
according to frequency distribution table is:
9. The Coefficient of Variance (C.V) of the
data according to frequency distribution
table is:
Does the above data take the bell shape?
Expert Solution
This question has been solved!
Explore an expertly crafted, step-by-step solution for a thorough understanding of key concepts.

This is a popular solution!

Trending now
This is a popular solution!

Step by step
Solved in 4 steps with 10 images

Recommended textbooks for you
Glencoe Algebra 1, Student Edition, 9780079039897…
Algebra
ISBN:
9780079039897
Author:
Carter
Publisher:
McGraw Hill
Glencoe Algebra 1, Student Edition, 9780079039897…
Algebra
ISBN:
9780079039897
Author:
Carter
Publisher:
McGraw Hill