The following data show the brand, price ($), and the overall score for six stereo headphones that were tested by Consumer Reports (Consumer Reports website). The overall score is based on sound quality and effectiveness of ambient noise reduction. Scores range from 0 = 23.8235 + 0.3118x , where x = price ($) and (lowest) to 100 (highest). The estimated regression equation for these data is ŷ y = overall score. Brand Price ($) Score Bose 180 75 Scullcandy 150 71 Koss 95 61 Phillips/O'Neill 70 57 Denon 60 40 JVC 45 26 a. Compute SST, SSR, and SSE (to 3 decimals). SST = SSR = SSE = b. Compute the coefficient of determination r² (to 3 decimals). Comment on the goodness of fit. Hint: If r² is greater than 0.70, the estimated regression equation provides a good fit. The least squares line - Select your answer - a good fit as - Select your answer - ÷ proportion of the variability in y has been explained by the least squares line. c. What is the value of the sample correlation coefficient (to 3 decimals)? Txy =
The following data show the brand, price ($), and the overall score for six stereo headphones that were tested by Consumer Reports (Consumer Reports website). The overall score is based on sound quality and effectiveness of ambient noise reduction. Scores range from 0 = 23.8235 + 0.3118x , where x = price ($) and (lowest) to 100 (highest). The estimated regression equation for these data is ŷ y = overall score. Brand Price ($) Score Bose 180 75 Scullcandy 150 71 Koss 95 61 Phillips/O'Neill 70 57 Denon 60 40 JVC 45 26 a. Compute SST, SSR, and SSE (to 3 decimals). SST = SSR = SSE = b. Compute the coefficient of determination r² (to 3 decimals). Comment on the goodness of fit. Hint: If r² is greater than 0.70, the estimated regression equation provides a good fit. The least squares line - Select your answer - a good fit as - Select your answer - ÷ proportion of the variability in y has been explained by the least squares line. c. What is the value of the sample correlation coefficient (to 3 decimals)? Txy =

Chapter4: Linear Functions
Section: Chapter Questions
Problem 40RE: For the following exercises, consider the data in Table 5, which shows the percent of unemployed ina...

Related questions
Question
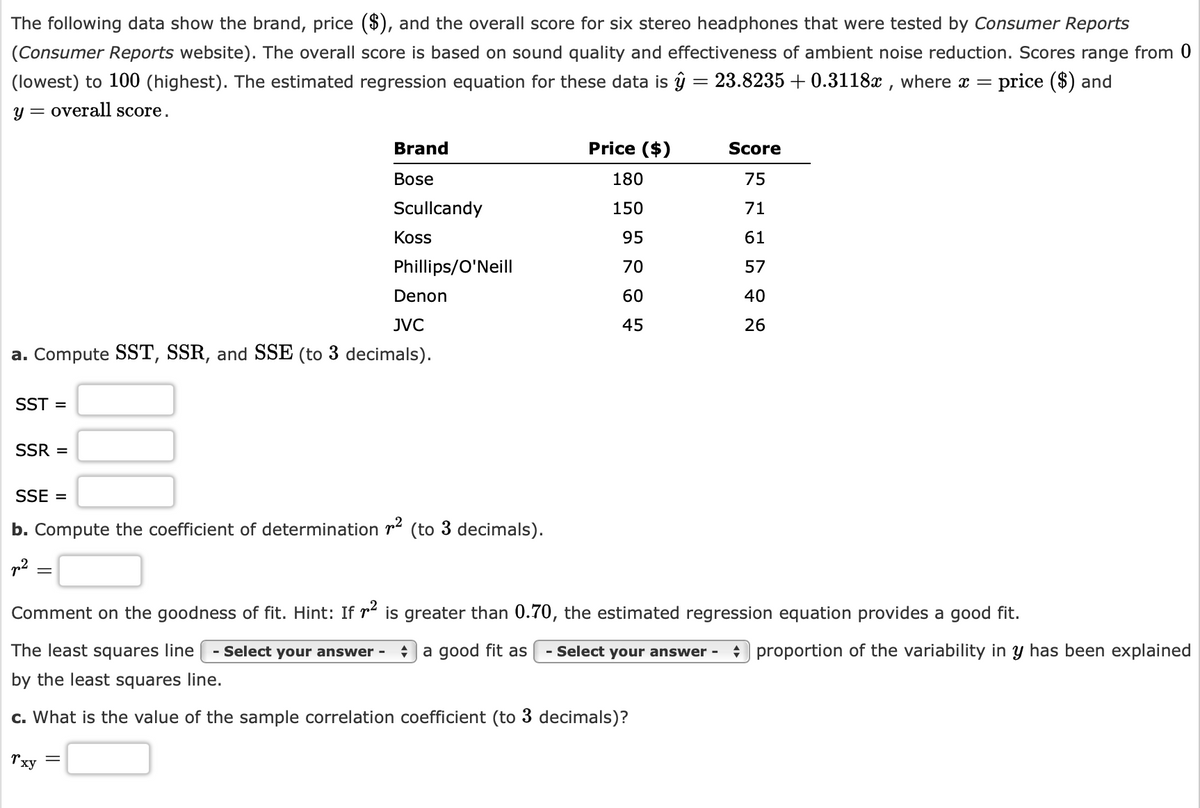
Transcribed Image Text:The following data show the brand, price ($), and the overall score for six stereo headphones that were tested by Consumer Reports
(Consumer Reports website). The overall score is based on sound quality and effectiveness of ambient noise reduction. Scores range from 0
(lowest) to 100 (highest). The estimated regression equation for these data is ŷ = 23.8235 + 0.3118x , where x = price ($) and
%3D
y = overall score.
Brand
Price ($)
Score
Bose
180
75
Scullcandy
150
71
Koss
95
61
Phillips/O'Neill
70
57
Denon
60
40
JVC
45
26
a. Compute SST, SSR, and SSE (to 3 decimals).
SST =
SSR =
SSE =
b. Compute the coefficient of determination r (to 3 decimals).
Comment on the goodness of fit. Hint: If r² is greater than 0.70, the estimated regression equation provides a good fit.
The least squares line
- Select your answer
+ a good fit as
Select your answer -
+ proportion of the variability in y has been explained
by the least squares line.
c. What is the value of the sample correlation coefficient (to 3 decimals)?
Txy
Expert Solution
This question has been solved!
Explore an expertly crafted, step-by-step solution for a thorough understanding of key concepts.

This is a popular solution!

Trending now
This is a popular solution!

Step by step
Solved in 4 steps

Recommended textbooks for you

Algebra and Trigonometry (MindTap Course List)
Algebra
ISBN:
9781305071742
Author:
James Stewart, Lothar Redlin, Saleem Watson
Publisher:
Cengage Learning

Algebra and Trigonometry (MindTap Course List)
Algebra
ISBN:
9781305071742
Author:
James Stewart, Lothar Redlin, Saleem Watson
Publisher:
Cengage Learning

Glencoe Algebra 1, Student Edition, 9780079039897…
Algebra
ISBN:
9780079039897
Author:
Carter
Publisher:
McGraw Hill

Functions and Change: A Modeling Approach to Coll…
Algebra
ISBN:
9781337111348
Author:
Bruce Crauder, Benny Evans, Alan Noell
Publisher:
Cengage Learning