The following data show the caries experience of 7527 children 12-14 years old in 21 comrnunities according to the flnoride concentration of their public water supply. DMF denotes "Decayed, Missing or Filled". 国 Community DMF #: per 100 Fleuride chikdren concentration in PPm 1 236 1.9 2.6 1.8 246 252 4 258 1.2 281 1.2 6. 303 1.2 323 1.3 343 0.9 6. 412 0.6 10 444 0.5 11 556 0.4 12 652 0.3 13 673 0.0 14 703 0.2 15 706 0.1 16 722 0.0 0.2 0.1 17 733 18 ל 19 810 0.0 20 823 0.1 21 1027 0.1 (a) Draw a rough scatter plot to visually examine the association between DMF teeth and Flouride. (b) Calculate the regression line of DMF teeth in flouride concentration. (c) What is the estimate of . the residual standard deviation?
The following data show the caries experience of 7527 children 12-14 years old in 21 comrnunities according to the flnoride concentration of their public water supply. DMF denotes "Decayed, Missing or Filled". 国 Community DMF #: per 100 Fleuride chikdren concentration in PPm 1 236 1.9 2.6 1.8 246 252 4 258 1.2 281 1.2 6. 303 1.2 323 1.3 343 0.9 6. 412 0.6 10 444 0.5 11 556 0.4 12 652 0.3 13 673 0.0 14 703 0.2 15 706 0.1 16 722 0.0 0.2 0.1 17 733 18 ל 19 810 0.0 20 823 0.1 21 1027 0.1 (a) Draw a rough scatter plot to visually examine the association between DMF teeth and Flouride. (b) Calculate the regression line of DMF teeth in flouride concentration. (c) What is the estimate of . the residual standard deviation?

Glencoe Algebra 1, Student Edition, 9780079039897, 0079039898, 2018
18th Edition
ISBN:9780079039897
Author:Carter
Publisher:Carter
Chapter10: Statistics
Section10.1: Measures Of Center
Problem 9PPS

Related questions
Question
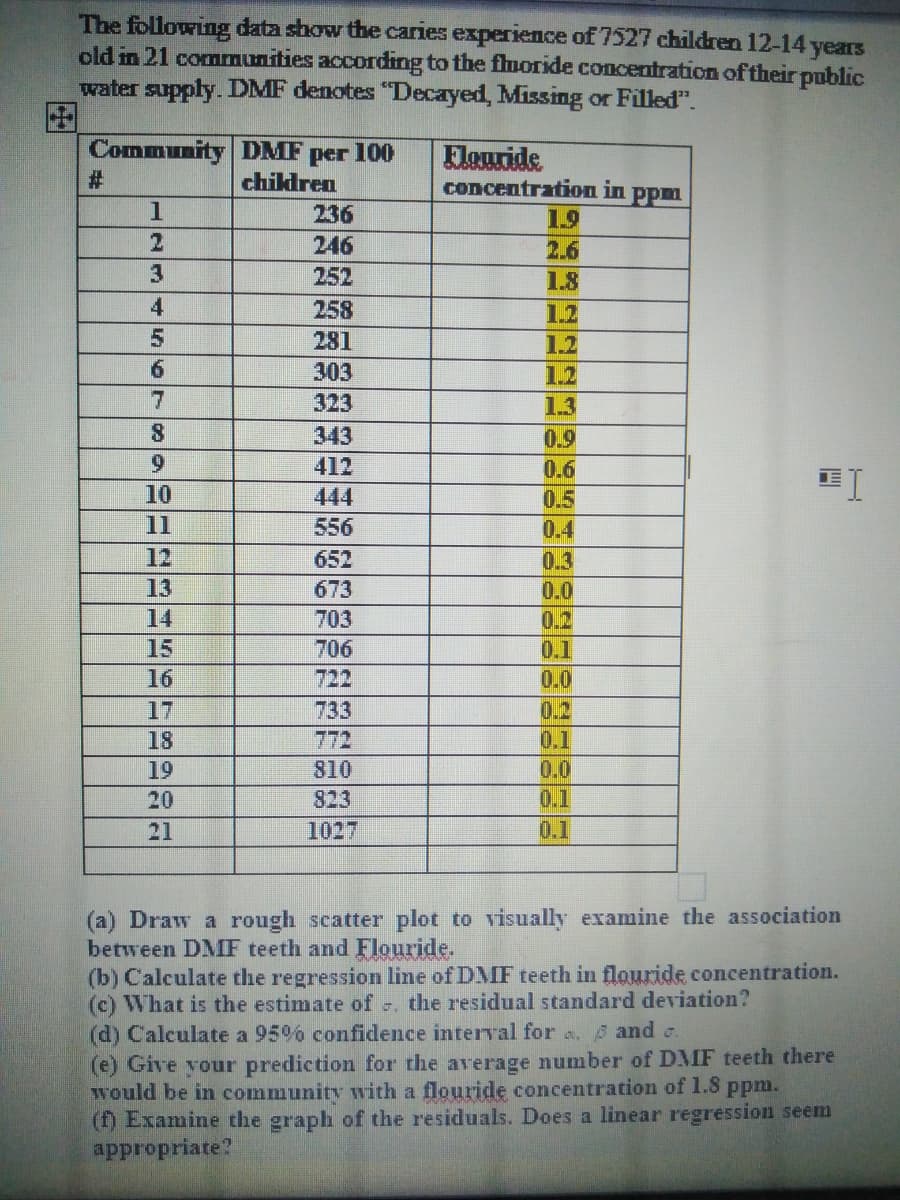
Transcribed Image Text:The following data show the caries experience of 7527 children 12-14 years
old in 21 communities according to the fluoride concentration of their public
water supply. DMF denotes "Decayed, Missing or Filled".
Community DMF
per
chikdren
100
Elouride
concentration in
#3
PPm
1
236
19
246
2.6
252
1.8
258
1.2
5.
281
1.2
303
1.2
323
1.3
343
0.9
6.
412
0.6
ET
10
444
0.5
11
556
0.4
12
652
0.3
13
673
0.0
0.2
14
703
15
706
0.1
0.0
0.2
0.1
16
722
17
733
18
772
0.0
0.1
19
810
20
823
21
1027
0.1
(a) Draw a rough scatter plot to visually examine the association
between DMF teeth and Flouride.
(b) Calculate the regression line of DMF teeth in flouride concentration.
(c) What is the estimate of , the residual standard deviation?
(d) Calculate a 95% confidence interval for a. and c.
(e) Give your prediction for the average number of DMF teeth there
would be in community with a flouride concentration of 1.8 ppm.
(f) Examine the graph of the residuals. Does a linear regression seem
appropriate?
Expert Solution
This question has been solved!
Explore an expertly crafted, step-by-step solution for a thorough understanding of key concepts.

Step by step
Solved in 3 steps with 4 images

Recommended textbooks for you
Glencoe Algebra 1, Student Edition, 9780079039897…
Algebra
ISBN:
9780079039897
Author:
Carter
Publisher:
McGraw Hill
Glencoe Algebra 1, Student Edition, 9780079039897…
Algebra
ISBN:
9780079039897
Author:
Carter
Publisher:
McGraw Hill