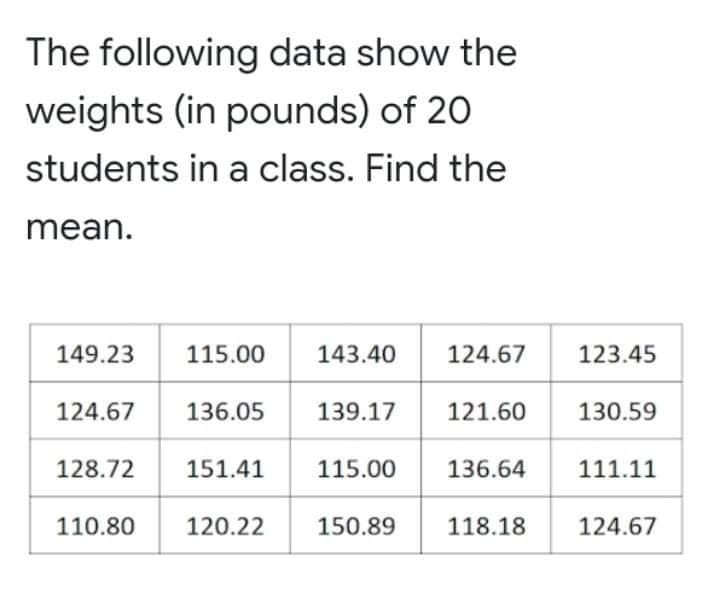
The following data show the weights (in pounds) of 20 students in a class. Find the mean. 149.23 115.00 143.40 124.67 123.45 124.67 136.05 139.17 121.60 130.59 128.72 151.41 115.00 136.64 111.11 110.80 120.22 150.89 118.18 124.67


Q: Find 94th percentile, P94, from the following data 170 210 220 230 320 360 370 390 430 440 470 540…
A: Arrange the given data in an ascending order. 170 210 220 230 320 360 370 390 430 440 470 540…
Q: The following tables about student scores in Physics and Statistics # OF STUDENTS PHYSICS…
A: Data is given for number of students for the scores of stastics and physics We have to calculate…
Q: A magazine collects data each year on the price of a hamburger in a certain fast food restaurant in…
A: It is given that the mean price of this hamburger in the U.S. in January was $4.61.
Q: Find the 94th percentile, P94, from the following data 1200 1400 1600 1700 2000 2100 2400 2500 3100…
A: The percentile no. p is a value such that at least p percent of the observations is less than or…
Q: The following data showing the heights of plants of two varieties of wheat:- Variety 1 Variety 2…
A: The given data is, Variety 1 Variety 2 87 82 91 84 89 85 88 83 89 90 91 89 87 94…
Q: Find the 94th percentile, P94, from the following data 1 2 3 10 11 13 15 16 17 20 21 22 30 31 33 37…
A: From the provided information, Total number of observations (n) = 39
Q: Find the 84th percentile, P84, from the following data 1000 1100 1200 1300 1600 1800 1900 2100…
A: Given information: The data points are arranged in ascending order as follows: 1000, 1100, 1200,…
Q: The following data give the numbers of computer keyboards assembled at the Twentieth Century…
A: Formula for finding percentile rank is,
Q: The following data relate to the age of a group of Govt. employees. Calculate the arithmetic mean…
A: Class Frequency (f) Mid value (x) d=X-Ahd=X-37.55A=37.5 , h=5 f⋅d f⋅d2 20 - 25 170 22.5 -3…
Q: A magazine collects data each year on the price of a hamburger in a certain fast food restaurant in…
A: Given that, Sample size n=12 Sample mean x¯=4.876 Sample standard deviation s=0.4698
Q: The following are the ages (in years) of all eight employees of a small company: 53 32 61 27 39 44…
A:
Q: Find the mean from the following data : 10 15 20 25 30 35 40 f 5 9 13 21 20 15 8 3
A:
Q: The following data are the top 50 women’s finish time (in minutes) in the 2013 ING New York City…
A: Since you have posted a question with multiple sub-parts, we will solve first three subparts for…
Q: Find the 14th percentile, P14, from the following data 2 8. 9 16 22 23 26 35 37 38 39 41 51 62 63 69…
A: For the given data sample size is, n= 29 14th percentile is given by, P14= 14*(n+1)/100 th term
Q: Find 64th percentile, P64, from the following data 100 110 160 180 190 210 220 260 280 290 310 | 350…
A: Solution
Q: The following data relate to the age of a group of Govt. employees Calculate the arithmetic mean and…
A: Given Data in ascending order : Age groups Number of employees (f) 20-25 170 25-30 110…
Q: Find the 74th percentile, P74, from the following data 1000 1100 1400 1500 2000 2300 2400 2500 2700…
A:
Q: Calculate mean deviation from the following data: Marks less than : 80 70 30 10 60 50 40 20 No. of…
A:
Q: The following table displays the ages of female actors when they starred in their award-winning…
A: Obtain the value of mean Use EXCEL Procedure for finding the value of mean. Follow the…
Q: A magazine collects data each year on the price of a hamburger in a certain fast food restaurant in…
A: From the provided information, Sample size (n) = 12 Level of significance (α) = 0.05
Q: Find the 54th percentile, P54, from the following data 1000 1500 1600 1700 1800 2000 2200 2300 3100…
A: The given data is 1000 2000 3500 4600 6700 8000 9000 1500 2200 3600 4700…
Q: Calculate the average (mean) of the data shown, to two decimal places x 14.9 18.2 15.9 14.5 24.1…
A: A set of data values is given. We need to find the average (mean) The solution to the given question…
Q: Find the 54th percentile, Ps4, from the following data 1. 6. 10 13 14 18 19 22 28 31 39 45 50 51 53…
A:
Q: Find 14th percentile, P14, from the following data 100 130 160 170 180 200 230 240 270 280 290 310…
A: The values which divide the total data into 100 equal partsare known as percentilesith percentile pi…
Q: Find 94th percentile, P94, from the following data 110 120 140 150 170 180 210 240 250 270 290 330…
A: Data set is given. Sample size = 29
Q: From the following frequency distribution, compute the Mean and standard deviation of 100 students…
A:
Q: Find 34th percentile, P34, from the following data 100 170 200 210 280 290 340 370 380 390 400 410…
A: The data are given calculate 34th percentile, For the calculation of percentile formula is,
Q: A magazine collects data each year on the price of a hamburger in a certain fast food restaurant in…
A: Given sample of restaurants in europe in january is…
Q: The table below gives the percent of children under five considered to be underweight. Percent of…
A:
Q: Find the mean and the mean deviation about mean from the following frequency distribution : Weight…
A: Mean deviation about mean : the mean of absolutely the values of the numerical variations between a…
Q: The following data shows the results for 20 students in one of the post graduate unit.42 66 67 71 78…
A: Solution: The observation in increasing order is 42, 53, 54, 61, 61, 61, 62, 63, 64, 66, 67, 67,…
Q: Find 34th percentile, P34, from the following data 170 270 120 210 230 260 320 370 400 490 500 510…
A:
Q: From the data given, calculate the mean bias in percentage, the value of MAR, and tracking signal…
A: The bias for each level is calculated by subtracting the calculated mean (Y values) from the…
Q: Find the 44th percentile, P44, from the following data 1000 1200 1300 1500 1700 1900 2100 2300 2500…
A: As per our guidelines we are suppose to answer only one question. Given,sample size(n)=38The given…
Q: Find the mean and the mean deviation about mean from the following frequency distribution : Weight…
A: Dispersion measure the spread of the observation from central tendency measures. There are some…
Q: Find 80th percentile, P80, from the following data 130 170 210 240 260 320 330 350 420 480 610 630…
A: Arrange data in accending order 130, 170, 210, 240, 260, 320, 330, 350, 420, 480, 610, 630, 640,…
Q: Find 64th percentile, P64, from the following data 120 140 170 180 210 220 240 270 280 300 350 400…
A: 64th percentile is given by, P64= value of 64*(n+1)/100 th term Where n is sample size and here n=…
Q: Find the 54th percentile, P54, from the following data 1400 1700 1900 2200 2400 2600 3000 3100 3200…
A: Given that, Number of observations = 31
Q: Calculate the weighted mean price of a table from the following data, assuming that weights are…
A:
Q: Find 84th percentile, P84, from the following data 100 110 140 150 170 280 290 320 360 370 400 420…
A: We have given that, The data of sample size n=31. Now, The pth percentile ( index i ): i = (p / 100)…
Q: Find the 64th percentile, P64, from the following dat 1400 2200 2300 2600 3000 3100 3200 3400 3700…
A: Total number of data point (n) = 27 Data is already given in non-descending order.
Q: Find 64th percentile, P64, from the following data 130 160 170 180 190 220 250 1280 330 380 400 410…
A: Given,sample size(n)=39The given data is already arranged in ascending order.
Q: The following distribution is for the number of children in a family. Find the mean number of…
A: According to the given information, we have The probability distribution table is given by, Y 0 1…
Q: The following data gives the highest points scored by a player in a given year from 2000 to 2009:…
A:
Q: magazine collects data each year on the price of a hamburger in a certain fast food restaurant in…
A: Given: Sample size of restaurants (n) = 12 The sample values given is as follows α=0.05
Q: Find the 34th percentile, P34, from the following data 1 3 7 11 12 20 26 28 37 40 41 43 46 47 51 52…
A: Formula used for 34th percentile. P34=(34(n+1)/100)th
Q: Find the 64th percentile, P64, from the following data 3 12 15 31 36 47 48 50 2 18 21 23 40 44 55 56…
A: Given data: 2,3,12,15,18,21,23,31,36,40,44,47,48,50,55,56,59,60,69,75,81,82,86,88,90,92,93,94,96
Q: Find the average deviation from the mean for the following distribution : 3 5 7 11 13 f: 2 7 10 9 5…
A:
Q: The following table displays the ages of female actors when they starred in their award-winning…
A: Given data: Ages of Female Award Recipients: 40, 42, 35, 34, 29, 29, 31, 32, ,29, 74, 35, 29, 34,…
Q: Find the 94th percentile, P94, from the following data 1200 1500 1800 2100 2200 2600 2700 2800 2900…
A: The sorted values are, The number of observations is, n =26 The value of index is,

Step by step
Solved in 2 steps with 1 images

- Read measurements on the enlarged fractional rule shown in Figure 30-12.Spacers are manufactured to the mean dimension and tolerance shown in Figure 29-12. An inspector measures 10 spacers and records the following thicknesses: 0.372" 0.376" 0.379" 0.375" 0.370" 0.373" 0.377" 0.378" 0.371" 0.380" Which spacers are defective (above the maximum limit or below the minimum limit)? All dimensions are in inches.The following data on sale price, size, and land-to-building ratio for 10 large industrial properties appeared in a paper. Property Sale Price(millionsof dollars) Size(thousandsof sq. ft.) Land-to-BuildingRatio 1 10.5 2167 2.1 2 2.6 750 3.4 3 30.6 2421 3.7 4 1.9 223 4.7 5 20.1 3916 1.7 6 8.1 2865 2.3 7 10.2 1699 3.2 8 6.6 1047 4.9 9 5.7 1107 7.5 10 4.4 405 17.3 (a) Calculate the value of the correlation coefficient between sale price and size. (Give the answer to three decimal places.)r = (b) Calculate the value of the correlation coefficient between sale price and land-to-building ratio. (Give the answer to three decimal places.)r = (c) If you wanted to predict sale price and you could use either size or land-to-building ratio as the basis for making predictions, which would you use? 1 - Size 2 - Land-to-building ratio (choose either 1 or 2 as the answer). (d) Based on your choice in Part (c), find the equation of the least-squares…
- The following data represent the length of life in minutes, measured to the nearest tenth, gathered from 45 back flies. 4.1 3.5 4.5 3.2 3.7 3.0 2.6 2.2 5.0 3.4 1.6 3.1 3.3 3.8 3.1 4.7 3.7 5.3 2.5 3.4 4.3 3.6 2.9 3.3 3.9 3.1 3.3 5.3 3.1 3.7 4.4 3.2 4.1 1.9 3.4 5.2 4.7 3.8 3.2 2.6 3.9 3.0 4.2 5.0 3.5 Construct a frequency distribution table with 6 class intervalsThe following data has been collected on the interarrival times of patients to an emergency department: 3.772, 1.761, 0.743, 15.988, 0.412, 7.541, 6.900, 3.447, 7.024, 1.061, 5.449, 0.309, 0.766, 4.807, 8.143, 0.093, 9.524, 0.012, 4.634, and 0.195 minutes. Estimate the squared coefficient of variation of the arrival process. Is the arrival process likely to be Poisson? Why or why not? Estimate the arrival rate?The following data are the measures of the diameters of 36 rivet heads in 1/100 of an inch:6.723 6.774 6.703 6.781 6.702 6.623 6.755 6.666 6.666 6.641 6.761 6.7326.802 6.722 6.761 6.761 6.685 6.665 6.626 6.726 6.762 6.703 6.785 6.7616.671 6.703 6.721 6.746 6.816 6.787 6.665 6.765 6.767 6.729 6.829 6.790a) Organize and Present the data in to Tabular form.b) Construct a Relative Frequency Histogram, Frequency Curve and Frequency Polygon of the data.c) Analyze whether or not there is any clear indication that the sample came from a population that hasNormal distribution.
- Following are the published weights (in pounds) of all of the team members of the San Francisco 49ers from a previous year.† 177; 205; 210; 210; 232; 205; 185; 185; 178; 210; 206; 212; 184; 174;185; 242; 188; 212; 215; 247; 241; 223; 220; 260; 245; 259; 278; 270;280; 295; 275; 285; 290; 272; 273; 280; 285; 286; 200; 215; 185; 230;250; 241; 190; 260; 250; 302; 265; 290; 276; 228; 265 Organize the data from smallest to largest value. Assume the population was the San Francisco 49ers. Find the following. (Round your answers to two decimal places.) (i) the population mean, μ (ii) the population standard deviation, σ (iii) the weight that is 2 standard deviations below the mean(iv) When Steve Young, quarterback, played football, he weighed 205 pounds. How many standard deviations above or below the mean was he? standard deviations ---Select--- above below the meanThe accompanying data file shows the square footage and associated property taxes for 20 homes in an affluent suburb 30 miles outside of New York City. Property_Taxes Size 21928 2449 17339 2479 18229 1890 15693 1000 43988 5665 33684 2573 15187 2200 16706 1964 18225 2092 16073 1380 15187 1330 36006 3016 31043 2876 42007 3334 14398 1566 38968 4000 25362 4011 22907 2400 16200 3565 29235 2864 1.Estimate a home’s property taxes as a linear function of the size of the home (measured by its square footage). Note: Round your answers to 2 decimal places. 2.What proportion of the sample variation in property taxes is explained by the home’s size? Note: Round your answer to 2 decimal places. 3. What proportion of the sample variation in property taxes is unexplained by the home’s size? Note: Round your answer to 2 decimal places.