The following data shows the ages of customers who owns a motorcycle. 31 42 62 21 60 66 68 63 54 22 37 42 75 61 44 52 33 36 47 45 51 51 28 39 43 52 53 33 Using excel, construct the following statistical graphs for the data set. A. Histogram B. Frequency Polygon C. Cumulative Frequency Polygon Provide appropriate labels for each of the statistical graphs. Then, also provide a brief analysis and interpretation for each of the resulting statistical graphs.
The following data shows the ages of customers who owns a motorcycle. 31 42 62 21 60 66 68 63 54 22 37 42 75 61 44 52 33 36 47 45 51 51 28 39 43 52 53 33 Using excel, construct the following statistical graphs for the data set. A. Histogram B. Frequency Polygon C. Cumulative Frequency Polygon Provide appropriate labels for each of the statistical graphs. Then, also provide a brief analysis and interpretation for each of the resulting statistical graphs.

Glencoe Algebra 1, Student Edition, 9780079039897, 0079039898, 2018
18th Edition
ISBN:9780079039897
Author:Carter
Publisher:Carter
Chapter10: Statistics
Section10.6: Summarizing Categorical Data
Problem 4AGP

Related questions
Question
PLS DO HELP!
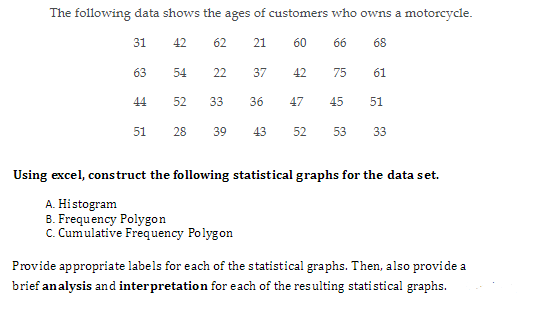
Transcribed Image Text:The following data shows the ages of customers who owns a motorcycle.
31 42
62
21
60
66
68
63
54
22
37
42
75
61
44
52
33
36
47
45
51
51
28
39
43
52
53
33
Using excel, construct the following statistical graphs for the data set.
A. Histogram
B. Frequency Polygon
C. Cumulative Frequency Polygon
Provide appropriate labels for each of the statistical graphs. Then, also provide a
brief analysis and interpretation for each of the resulting statistical graphs.
Expert Solution
This question has been solved!
Explore an expertly crafted, step-by-step solution for a thorough understanding of key concepts.

Step by step
Solved in 3 steps with 2 images

Recommended textbooks for you
Glencoe Algebra 1, Student Edition, 9780079039897…
Algebra
ISBN:
9780079039897
Author:
Carter
Publisher:
McGraw Hill
Glencoe Algebra 1, Student Edition, 9780079039897…
Algebra
ISBN:
9780079039897
Author:
Carter
Publisher:
McGraw Hill