The following data were collected during a study of consumer buying patterns: Observation Observation 1. 18 69 19 81 2. 26 81 14 75 41 85 10 10 76 4. 35 77 11 25 83 56 95 12 21 86 46 93 13 29 90 33 86 Click here for the Excel Data File b. Obtain a linear regression line for the data (Round your intermediete calculations and final answers to 3 decimal pleces.) y3=
The following data were collected during a study of consumer buying patterns: Observation Observation 1. 18 69 19 81 2. 26 81 14 75 41 85 10 10 76 4. 35 77 11 25 83 56 95 12 21 86 46 93 13 29 90 33 86 Click here for the Excel Data File b. Obtain a linear regression line for the data (Round your intermediete calculations and final answers to 3 decimal pleces.) y3=

Database System Concepts
7th Edition
ISBN:9780078022159
Author:Abraham Silberschatz Professor, Henry F. Korth, S. Sudarshan
Publisher:Abraham Silberschatz Professor, Henry F. Korth, S. Sudarshan
Chapter1: Introduction
Section: Chapter Questions
Problem 1PE

Related questions
Question
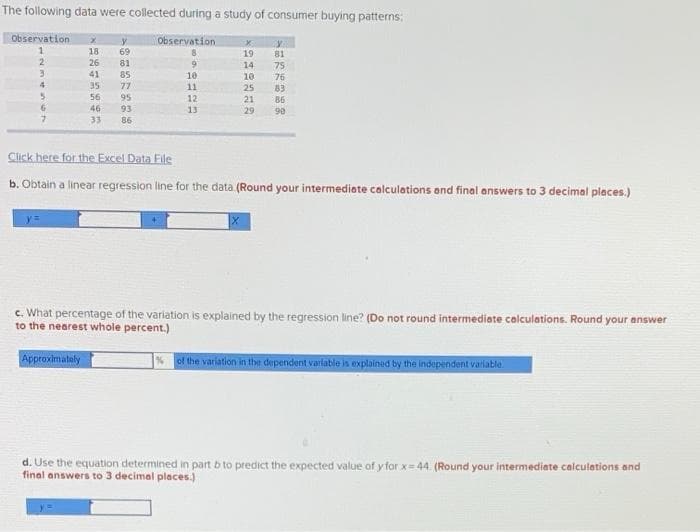
Transcribed Image Text:The following data were collected during a study of consumer buying patterns:
Observation
Observation
y.
69
y.
18
19
81
2
26
81
9
14
75
41
85
10
10
76
4
35
77
11
25
83
56
95
12
21
86
46
93
13
29
90
33
86
Click here for the Excel Data File
b. Obtain a linear regression line for the data (Round your intermediote calculations and final answers to 3 decimal places.)
y3=
c. What percentage of the variation is explained by the regression line? (Do not round intermediate calculations. Round your answer
to the nearest whole percent.)
Approximately
of the varlation in the dependent varlable is explainud by the independent variable
d. Use the equation determined in part b to predict the expected value of y for x 44. (Round your intermediate calculations and
final answers to 3 decimal places.)
Expert Solution
This question has been solved!
Explore an expertly crafted, step-by-step solution for a thorough understanding of key concepts.

This is a popular solution!

Trending now
This is a popular solution!

Step by step
Solved in 2 steps

Knowledge Booster


Learn more about
Need a deep-dive on the concept behind this application? Look no further. Learn more about this topic, computer-science and related others by exploring similar questions and additional content below.Recommended textbooks for you
Database System Concepts
Computer Science
ISBN:
9780078022159
Author:
Abraham Silberschatz Professor, Henry F. Korth, S. Sudarshan
Publisher:
McGraw-Hill Education

Starting Out with Python (4th Edition)
Computer Science
ISBN:
9780134444321
Author:
Tony Gaddis
Publisher:
PEARSON

Digital Fundamentals (11th Edition)
Computer Science
ISBN:
9780132737968
Author:
Thomas L. Floyd
Publisher:
PEARSON
Database System Concepts
Computer Science
ISBN:
9780078022159
Author:
Abraham Silberschatz Professor, Henry F. Korth, S. Sudarshan
Publisher:
McGraw-Hill Education
Starting Out with Python (4th Edition)
Computer Science
ISBN:
9780134444321
Author:
Tony Gaddis
Publisher:
PEARSON
Digital Fundamentals (11th Edition)
Computer Science
ISBN:
9780132737968
Author:
Thomas L. Floyd
Publisher:
PEARSON

C How to Program (8th Edition)
Computer Science
ISBN:
9780133976892
Author:
Paul J. Deitel, Harvey Deitel
Publisher:
PEARSON

Database Systems: Design, Implementation, & Manag…
Computer Science
ISBN:
9781337627900
Author:
Carlos Coronel, Steven Morris
Publisher:
Cengage Learning

Programmable Logic Controllers
Computer Science
ISBN:
9780073373843
Author:
Frank D. Petruzella
Publisher:
McGraw-Hill Education