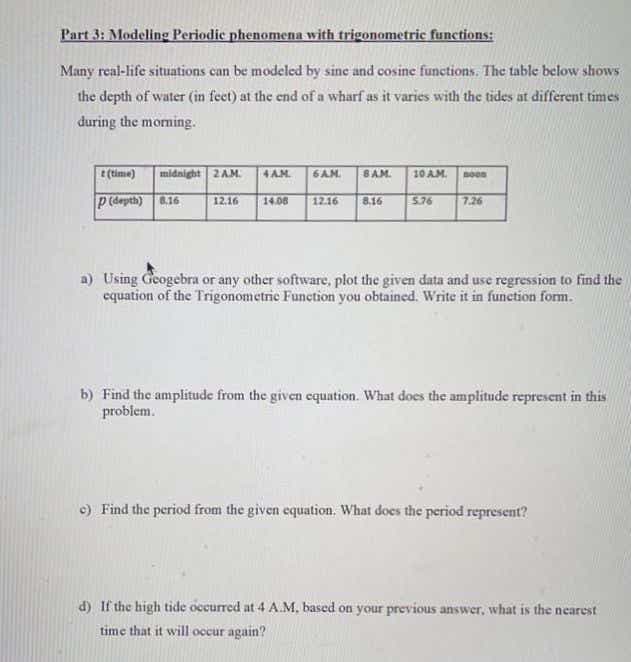
Many real-life situations can be modeled by sine and cosine functions. The table below shows the depth of water (in feet) at the end of a wharf as it varies with the tides at different times during the morming. t (time) midnight 2AM. 4AM. 6AM. BAM. 10 AM. p(depth) 5.76 8.16 12.16 14.08 12.16 8.16 7.26 a) Using Geogebra or any other software, plot the given data and use regression to find the equation of the Trigonometric Function you obtained. Write it in function form. b) Find the amplitude from the given equation. What does the amplitude represent in this problem. c) Find the period from the given equation. What does the period represent? d) If the high tide occurred at 4 A.M, based on your previous answer, what is the nearest time that it will occur again?
Many real-life situations can be modeled by sine and cosine functions. The table below shows the depth of water (in feet) at the end of a wharf as it varies with the tides at different times during the morming. t (time) midnight 2AM. 4AM. 6AM. BAM. 10 AM. p(depth) 5.76 8.16 12.16 14.08 12.16 8.16 7.26 a) Using Geogebra or any other software, plot the given data and use regression to find the equation of the Trigonometric Function you obtained. Write it in function form. b) Find the amplitude from the given equation. What does the amplitude represent in this problem. c) Find the period from the given equation. What does the period represent? d) If the high tide occurred at 4 A.M, based on your previous answer, what is the nearest time that it will occur again?

Operations Research : Applications and Algorithms
4th Edition
ISBN:9780534380588
Author:Wayne L. Winston
Publisher:Wayne L. Winston
Chapter9: Integer Programming
Section9.2: Formulating Integer Programming Problems
Problem 9P

Related questions

Question
Solvs ASAP
Transcribed Image Text:Part 3: Modeling Periodic phenomena with trigonometric functions:
Many real-life situations can be modeled by sine and cosine functions. The table below shows
the depth of water (in feet) at the end of a wharf as it varies with the tides at different times
during the moming.
E (time)
midnight 2AM.
4 AM.
6AM.
SAM.
10 AM.
noos
p(depth)
5.76
7.26
8.16
12.16
14.08
12.16
8.16
a) Using Geogebra or any other software, plot the given data and use regression to find the
equation of the Trigonometric Funetion you obtained. Write it in function form.
b) Find the amplitude from the given cquation. What does the amplitude represent in this
problem.
c) Find the period from the given equation. What does the period represent?
d) If the high tide occurred at 4 A.M, based on your previous answer, what is the nearest
time that it will occur again?
Expert Solution
This question has been solved!
Explore an expertly crafted, step-by-step solution for a thorough understanding of key concepts.

This is a popular solution!

Trending now
This is a popular solution!

Step by step
Solved in 2 steps with 3 images

Knowledge Booster


Learn more about
Need a deep-dive on the concept behind this application? Look no further. Learn more about this topic, computer-science and related others by exploring similar questions and additional content below.Recommended textbooks for you
Operations Research : Applications and Algorithms
Computer Science
ISBN:
9780534380588
Author:
Wayne L. Winston
Publisher:
Brooks Cole
Operations Research : Applications and Algorithms
Computer Science
ISBN:
9780534380588
Author:
Wayne L. Winston
Publisher:
Brooks Cole