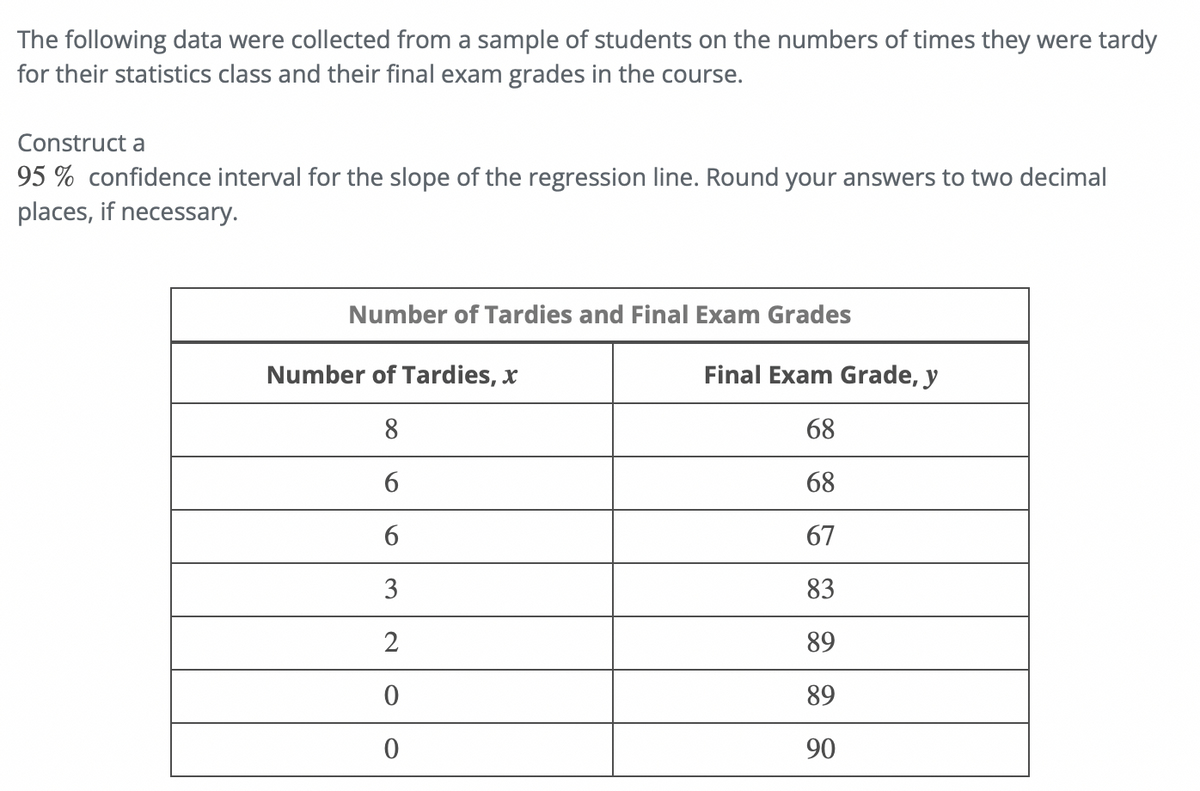
The following data were collected from a sample of students on the numbers of times they were tardy for their statistics class and their final exam grades in the course. Construct a 95% confidence interval for the slope of the regression line. Round your answers to two decimal places, if necessary. Number of Tardies and Final Exam Grades Number of Tardies, x 8 6 6 3 2 0 0 Final Exam Grade, y 68 68 67 83 89 89 90
Q: A bag contains 10 white marbles, 4 blue marbles, 6 red marbles. If one marble is drawn from the bag…
A: Note: As per my policy i can answer only one question. kindly repost the remaining questionsGiven…
Q: The hypothesis statement H: Xbar= 100 is an example of a null hypothesis. Select one: O True O False
A: We have given the statement H:Xbar=100. We need to find that whether it is an example of null…
Q: Find the probability that a dinner has 600mg or more sodium. 0.00380.0038 0.10560.1056…
A: It is given that Mean, μ = 540 Standard deviation, σ = 48 Z-Score, Z = ( X - μ )/σ
Q: Medicare would like to test the hypothesis that the average monthly rate for one- bedroom…
A: Given n=sample size=12, sample mean x̄=3690, s=sample standard deviations=530, level of significance…
Q: For a standardized normal distribution, calculate the probabilities below. a. P(0.00<z≤2.26) b.…
A:
Q: 6. The box-and-whisker plot below represents the tube width data from the previous problem. a. One…
A: Since you have posted a question with multiple subparts, we will solve first three subparts for you.…
Q: You have an independent variable of “drug condition.” The people who get the drug would be the…
A: Sample is the subset of population. It is smaller in size compared to population. It can be any part…
Q: State the null hypothesis H0 and the alternative hypothesis H1 . H0: H1: (b) Determine the type of…
A: It is given that Sample size n = 155 Number of babies weigh more than 7 pounds, X = 88 Level of…
Q: me results of a certain medical test are normally distributed with a mean of 127 and a standard…
A: Given data,Mean μ=127sd σ=12P(X>133)=?
Q: Given info: A card is selected from a pack of cards and then it is replaced. This is done for five…
A: Given that a card is selected from a pack of cards and then it is replaced and n=5
Q: If 2 of 20 tires are defective and 8 of them are randomly chosen for inspection.what is the…
A:
Q: The following table shows the results of a survey on changing vendors from Coke to Pepsi on campus.…
A: Given Favor Oppose No Opinion Freshman 53 35 12 Sophomore 54 32 14
Q: One personality test available on the World Wide Web has a subsection designed to assess the…
A: The test is to check whether the population mean is less than 145.
Q: A hypothesis test is to be performed. Determine the null and alternative hypotheses. The maximum…
A: We need to determine the null and alternative hypothesis for the given problem.
Q: A food safety guideline is that the mercury in fish should be below 1 part per million (ppm).…
A: Confidence interval is the range of parameter. It has the combined value of mean and margin of…
Q: For the following Before/After data, calculate the t-obtained for a Related-Samples t-test. a. 2.53…
A: For using Paired t test 1) sample size of two samples should be equal 2) two samples should be not…
Q: 8.94 An automobile dealer wants to estimate the propor- tion of customers who still own the cars…
A: Population proportion Population proportion is a parameter that describes a percentage value…
Q: Determine the P-value for a one-sided test with z = 1.89
A: here given , hypothesis test is one tail test statistic = 1.89 use excel command for p -value
Q: The data shown to the right for the dependent variable, y, and the independent variable, x, have…
A: The given data is: x y 11 110 15 150 12 120 15 130 14 140 10 100…
Q: On a test, John scored at the 50th percentile and Jim scored at the 25th percentile; therefore,…
A: A percentile indicates a score's position in relation to those other values from the same dataset.…
Q: population standard deviation is 0.6 are given. Ho: 27.1, H₁: p<7.1 and a significance level is…
A:
Q: The latest results from a method of gender selection shows that among 152 sets of parents using the…
A: Given data The latest results from a method of gender selection shows that among 152 sets of parents…
Q: Construct a 98% confidence interval to estimate the population mean with x = 61 and o=13 for the…
A:
Q: Which option below contains only things that match each other? pα, Obt in tail past Crit, Conclude…
A: When we do an experiment, We get result p value is probability to get more extreme value than…
Q: A sample of test scores is obtained. The scores are displayed as follows: 11, 16, 19, 15, 7, 8, 10…
A: HERE AS PER GUIDELINES I HAVE CALCULATED FIRST MAIN QUESTION HERE given , A sample of test scores…
Q: One of the biggest issues facing e-retailers is the ability to turn browsers into buyers. This is…
A: Using z test for single proportion test.
Q: The average speed of cars on 495 is 74 mph with a standard deviation of 6. What is the probability…
A: GivenMean(μ)=74standard deviation(σ)=6
Q: Express your answer in the format of E. $ +$
A: From given data we have: sample size = n=12 Mean=x¯=50.9 Standard deviation=S=2.3 Degrees of freedom…
Q: (a) Find P(X/Y ≤t) and P(XY ≤t). b) Find P(XY/Z <t).
A: a) we have to find PXY≤t and P(X≤tY) Consider, P(XY≤t=P(X≤tY)=PXt≤Y now, the denominator t has two…
Q: the given data to do the llowing. ind the regression equation for the data points. Sraph the…
A: Data is as follows x y 2 1 5 6 4 3 1 -2 3 1
Q: The body temperatures of a group of healthy adults have a bell-shaped distribution with a mean of…
A:
Q: What is the computed p-value for the given data on the "BMI" before ("Pre") and after ("Post") the…
A: We will use paired samples t test for the given problem and we will use R software for my…
Q: For the following two samples of scores, calculate the pooled variance from an Independent-Samples…
A: The following information has been given: n1=15 n2=15x¯1=119…
Q: For an exam with a mean of μ = 84 and a standard deviation of σ = 6, Mary has a score of X = 93,…
A: GivenMean(μ)=84standard deviation(σ)=6
Q: A poll asked whether states should be allowed to conduct random drug tests on elected officials. Of…
A:
Q: The weights of 40 pupils are shown below 1. Group the data into classes of width 5 kg starting with…
A: The Given weights of 40 pupils. To find the Group the data into classes of width 5kg starting with…
Q: Find D,y using the rules for finding derivatives. y = (9x² - 5) (3x² - 8x+4) Dxy=
A: Given: y = (9X2-5)(3X2-8X+4) Formula Used: Dxy = dydx ddx(uv) = dudxv+udvdx
Q: The alternative hypothesis, denoted by H0, represents the status quo and involves stating the belief…
A: Since we know that The null hypothesis is denoted by H0 and involves stating the belief that the…
Q: Find a 90% confidence interval for the population mean price (per 100 pounds) that farmers in this…
A: Given that Sample size n =45 Sample mean =6.88 Population standard deviation =2
Q: Give a 99% confidence interval, for μ₁ −μ₂ given the following information. n₁ = 60, x1 = 2.53, $1…
A: Given 99% confidence interval, n1 = 60, x1=2.53 n2 = 50, X2=2.95 S1=0.78,S2=0.94
Q: Question 8 Netflix Addiction. A research was conducted to assess the impact of Netflix on students'…
A: The range used to estimate the unknown parameter is known as confidence interval. It has two limits…
Q: The bar chart above is to be used for problems 17-19. It represents the probability density function…
A: Each variable can be determined into two types. They can can be discrete or continuous. Discrete…
Q: school juniors worked more hours per week than high school seniors. His findings are in the table…
A: Given that Senior Junior Mean 18.5 19.1 Population Standard Deviation 7.1 8.4 Sample size…
Q: esearch Institute reports that 66% of workers reported that they and/or their spouse had saved some…
A:
Q: Medicare would like to test the hypothesis that the average monthly rate for one- bedroom…
A: Givensampele size(n)=12Mean(x)=3690standard deviation(s)=530significance level(α)=0.05
Q: Consider there are N statistically independent random variables X„‚n = 1,2,.….....N, . The sum of…
A:
Q: You want to study whether music affects people’s ability to learn. You have 10 college students…
A: Test is that whether people's ability to learn ks effected by music.
Q: (a) P(x≤ a) = 0.81 a = (b) P(xa) = 0.67 (c) P(x ≥ a) = 0.61 (d) P(x > a) = 0.86 a =
A: Given that X~ U ( 2,5)
Q: Which distribution does the test for correlation use (LinRegTTest)? z distribution t distribution it…
A: We have to tell, Which distribution is used for correlation. Z distribution or t distribution
Q: (a) Presented with "Heads or Tails", 118 out of 140 put Heads. Value = i Confidence interval: i…
A: The answers given in the steps below. Thanks!
Trending now
This is a popular solution!
Step by step
Solved in 2 steps with 1 images
- Find the equation of the regression line for the following data set. x 1 2 3 y 0 3 4Use the following information from a multiple regression analysis to complete below n=35 b1=25 b2=25 Sb1=10 Sb2=8 Construct a 95% confidence interval estimate of the population slope, β1.______≤β1≤________ (Round to four decimal places as needed.)Use the following information from a multiple regression analysis to complete parts (a) through (c) below. n=25 b1=5 b2=15 Sb1=2 Sb2=4 b. Construct a 95% confidence interval estimate of the population slope, β1. __________≤β1≤_____________ (Round to four decimal places as needed.)
- Use the following information from a multiple regression analysis. n=15 b1=2 b2=6 Sb1=1.4 Sb2=0.5 a. Which variable has the largest slope, in units of a t statistic? b. Construct a 90% confidence interval estimate of the population slope, β1. c. At the 0.10 level of significance, determine whether each independent variable makes a significant contribution to the regression model. On the basis of these results, indicate the independent variables to include in this model.Given below are seven observations collected in a regression study on two variables, x (independent variable) and y (dependent variable). Copy and paste the numbers in an Excel worksheet and then use Excel's Regression tool to conduct a simple linear regression analysis. Choose 95% confidence level. Answer the following questions: x y 2 12 3 9 6 8 7 7 8 6 7 5 9 2 t statistics is statistically significant at 5% level. Answer Yes or No. Yes No What is the lower bound of the 95% confidence interval for the independent variable x (Keep 2 decimal places) What is the upper bound of the 95% confidence interval for the independent variable x (Keep 2 decimal places)A sample of n = 120 scores were presented using the Tenacity (authority) scores to the following predictors: age gender, SES, tone of voice, and clothing. Using a two-tailed test at the 0.05 level of significance, a multiple regression analysis was computed: 1. tenacity and age (pvalue = 0.043); 2. tenacity and gender (pvalue = 0.102); 3. tenacity and SES (pvalue = 0.40); Using the pvalue, provide your DECISION, whether: Accept Ho or Reject Ho, Accept Ha
- An Internet retailer would like to investigate the relationship between the amount of time in minutes a purchaser spends on its Web site and the amount of money he or she spends on an order. The table to the right shows the data from a random sample of 12customers. Construct a 90% confidence interval for the regression slope. Order Size Time Order Size 17 $73 3 $60 14 $25 38 $365 26 $96 7 $126 22 $196 38 $158 1 $51 25 $76 12 $39 8 $252 Construct a 90% confidence interval for the slope. LCL= UCL= (Round to three decimal places as needed.)A sample of n = 120 scores were presented using the Tenacity (authority) scores to the following predictors: age gender, SES, tone of voice, and clothing. Using a two-tailed test at the 0.05 level of significance, a multiple regression analysis was computed: 1. tenacity and age (pvalue = 0.043) Using the pvalue, provide your DECISION, whether: Accept Ho or Reject Ho, Accept HaA sample of n = 120 scores were presented using the Tenacity (authority) scores to the following predictors: age gender, SES, tone of voice, and clothing. Using a two-tailed test at the 0.05 level of significance, a multiple regression analysis was computed: 4. tenacity and voice (pvalue = 0.001); Using the pvalue, provide your DECISION, whether: Accept Ho or Reject Ho, Accept Ha
- A sample of n= 120 scores were presented using the tendency(authority) scores to the following predictors age gender, SES, tone of voice, and clothing. Using a two-tailed at the 0.05 level of significance, a multiple regression analysis was computed Using the pvalue, provide your DECISION, whether ACCEPT Ho or REJECT HO,ACCEPT Ha 1.) Tenacity and SES(pvalue=0.40) 2.) Tenancity and voice(pvalue=0.001) 3.) Tenancity and clothing(pvalue=0.017)A sample of n = 120 scores were presented using the Tenacity (authority) scores to the following predictors: age gender, SES, tone of voice, and clothing. Using a two-tailed test at the 0.05 level of significance, a multiple regression analysis was computed: 1. tenacity and age (pvalue = 0.043); 2. tenacity and gender (pvalue = 0.102); 3. tenacity and SES (pvalue = 0.40); 4. tenacity and voice (pvalue = 0.001); 5. tenacity and clothing (value = 0.017); SOrs Using the pvalue, provide your DECISION, whether:Accept Ho or Reject Ho, Accept HaA sample of n = 120 scores were presented using the Tenacity (authority) scores to the following predictors: age gender, SES, tone of voice, and clothing. Using a two-tailed test at the 0.05 level of significance, a multiple regression analysis was computed: 5. tenacity and clothing (value = 0.017); SOrs Using the pvalue, provide your DECISION, whether: Accept Ho or Reject Ho, Accept Ha