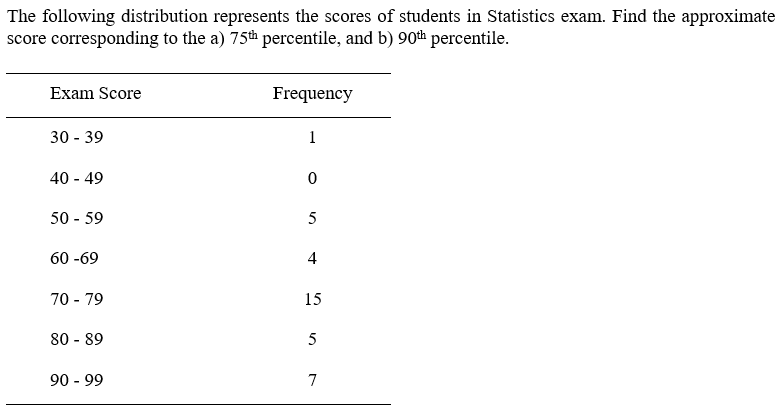
The following distribution represents the scores of students in Statistics exam. Find the approximate score corresponding to the a) 75th percentile, and b) 90th percentile. Exam Score Frequency 30 - 39 1 40 - 49 50 - 59 5 60 -69 4 70 - 79 15 80 - 89 5 90 - 99 7
The following distribution represents the scores of students in Statistics exam. Find the approximate score corresponding to the a) 75th percentile, and b) 90th percentile. Exam Score Frequency 30 - 39 1 40 - 49 50 - 59 5 60 -69 4 70 - 79 15 80 - 89 5 90 - 99 7

Glencoe Algebra 1, Student Edition, 9780079039897, 0079039898, 2018
18th Edition
ISBN:9780079039897
Author:Carter
Publisher:Carter
Chapter10: Statistics
Section10.5: Comparing Sets Of Data
Problem 13PPS

Related questions
Question
100%
Transcribed Image Text:The following distribution represents the scores of students in Statistics exam. Find the approximate
score corresponding to the a) 75th percentile, and b) 90th percentile.
Exam Score
Frequency
30 - 39
1
40 - 49
50 - 59
5
60 -69
4
70 - 79
15
80 - 89
5
90 - 99
7
Expert Solution
This question has been solved!
Explore an expertly crafted, step-by-step solution for a thorough understanding of key concepts.

Step by step
Solved in 3 steps with 3 images

Recommended textbooks for you
Glencoe Algebra 1, Student Edition, 9780079039897…
Algebra
ISBN:
9780079039897
Author:
Carter
Publisher:
McGraw Hill
Glencoe Algebra 1, Student Edition, 9780079039897…
Algebra
ISBN:
9780079039897
Author:
Carter
Publisher:
McGraw Hill