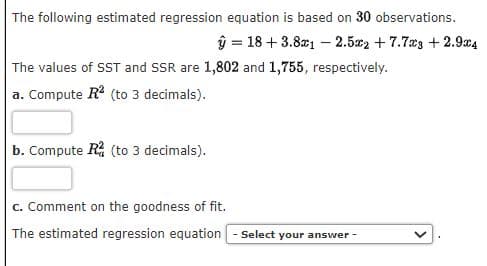
The following estimated regression equation is based on 30 observations. y = 18+3.8x1-2.5x2 +7.7x3 + 2.9x4 The values of SST and SSR are 1,802 and 1,755, respectively. a. Compute R² (to 3 decimals). b. Compute R² (to 3 decimals). c. Comment on the goodness of fit. The estimated regression equation - Select your answer- く


Q: Is there any indication that either factor influences brightness? Use a = 0.05. Do the two factors…
A: The data set has Glass type and Phosphor type as two variables.1#Create the Dataset 2data <-…
Q: The manufacturer of a new eye cream claims that the cream reduces the appearance of fine lines and…
A: The objective of this question is to test the claim of the manufacturer that the new eye cream…
Q: Find the area of the shaded region. The graph to the right depicts IQ scores of adults, and those…
A: Given ,Mean , 100Standard deviation , 15 Also , the given graph is : We have to find the area of the…
Q: Predict sale ($thousands) Y based on living space in the house (square feet) (denoted as X1) and…
A: The regression output table is given in the question.It is required to obtain the predicted asking…
Q: Find the area of the shaded region. The graph depicts the standard normal distribution with mean 0…
A: The graph represents the standard normal distribution with mean 0 and standard deviation of 1. That…
Q: You run your test and your sample (test statistic) is 1.98. Your statistician informs you that your…
A: Given: Test statistics t = 1.98Critical value tc = 1.66Degree of freedom df = 99Level of…
Q: The Nielsen company surveyed 257 owners of android phones and found that 217 of them planned to get…
A: From the provided information,
Q: If the null and alternative hypothesis are respectively: H0:μ ≤ 50; H1: μ> 50, then what tailed test…
A: Given that,H0 : u ≤ 50H1 : u ≥ 50
Q: Because of a mistake in packaging, a case of 1616 bottles of wine contained 77 of brand A and 99 of…
A: From the provided information,Total number of bottles =16Number of bottles of brand A = 7Number of…
Q: According to scientists, the cockroach has had 300 million years to develop a resistance to…
A: The objective of this question is to find a 95% confidence interval for the mean number of roaches…
Q: On a 5-day vacation, the forecast is a 34% chance of rain every day. What is the probability that it…
A: n=sample size=number of days=5, p=probability of raining every day=0.34
Q: A salesman for a new manufacturer of cellular phones claims not only that they cost the retailer…
A: It is required to test the claim that the percentage of defective cellular phones found among his…
Q: None
A: The following data is given MonthNumber of bottles soldOperating…
Q: Bonferroni (I) VAR00002 (J) VAR00002 Mean Difference (I-J) Std. Error Sig. 95%…
A: The objective of the question is to identify the most significant pair-wise comparison prior to any…
Q: Starting salaries of 110 college graduates who have taken a statistics course have a mean of…
A: sample size(n)=110Mean()=44732standard deviation()=8194confidence level=85%
Q: K For the following information, determine whether a normal sampling distribution can be used, where…
A: From the provided information,Claim: Sample statistics:
Q: Three different businesses in Montclair are listed as small, medium, and large. The variable that…
A: Given the following statement Three different businesses in Montclair are listed as small, medium,…
Q: The level of lead in the blood was determined for a sample of 152 male hazardous-waste workers age…
A: Let x1 denote the level of lead in the blood of male hazardous-waste workers aged 20-30.and x1…
Q: For samples of the specified size from the population described, find the mean and standard…
A: 20) Given,Population mean, μ = 86 inches.Population standard deviation, σ = 14 inches.Sample size, n…
Q: Conduct a t-test at the .01 level. You are interested in the income of American adults. In your…
A: Please see ExplanationExplanation:Given:a = 0.01n = 361x = 19500s = 3800 We need to test if the mean…
Q: A manufacturer knows that their items have a normally distributed lifespan, with a mean of 14 years,…
A: The probability that one item will last longer than 24 years is 0.002737 or 0.003.Explanation:A…
Q: Resistors for electronic circuits are manufactured on a high-speed automated machine. The machine is…
A: The sample information for 15 samples is given as:Sample…
Q: The proportion of adults living in a small town who are college graduates is estimated to be p=0.3.…
A: The null and alternative hypotheses are assumed as:The value of needs to obtain for alternative…
Q: You are studying the concentration of the hormone cortisol in European Starlings (bird). One group…
A: Two-sided pooled variance t-testExplanation:The best type of test to assess the research question…
Q: 2) An accounting firm is interested in estimating the error rate in a compliance audit it is…
A: Please go through the below answerExplanation:
Q: Obtained vaule from community is -1.49 and the critical vaule of the state is 1.96. Compare the…
A: The objective of this question is to compare the obtained value from the community to the critical…
Q: A food-frequency questionnaire is used to measure dietary intake. The respondent specifies the…
A: Blood PressureDietary CholesterolHigh LowTotalHigh 15991250Low78172250Total237263500
Q: A high school senior wonders if being blindfolded affects a person's typing accuracy. He randomly…
A: Ans: because the p-value is less than , there is evidence of a difference on average in typing…
Q: Concrete formulated for use in commercial structures is designed to withstand pressures of 4000…
A: Mean = 4169.6Standard deviation = 186.0459Explanation:Step 1:From data we…
Q: The success of an airline depends heavily on its ability to provide a pleasant customer experience.…
A: The study calculates the sample mean number of minutes late for delayed flights for Delta and…
Q: Put the following equation in slope-intercept form: y-5=2(x-2) Y Question Help: Video Submit…
A: The slope intercept form is y=2x+1.Explanation:Steps and explanations are as follows:
Q: A company that makes robotic vacuums claims that their newest model of vacuum lasts, on average, two…
A: The run time (in hours) of the random sample of five vacuums of the newest model. Here are the run…
Q: A researcher compares two compounds (1 and 2) used in the manufacture of car tires that are designed…
A: p value is less than 0.05Explanation:
Q: An agronomist would like to estimate the average weight of all Indian River County oranges. The mean…
A: From the provided information,The sample size (n) = 115Sample mean = 129Population standard…
Q: Given the following history, use a three-quarter moving average to forecast the demand for the third…
A: The data set islast yearthis…
Q: The number of cancer cases by smoking status is shown in below table is a sample of randomly…
A: The objective of this question is to calculate the odds ratio based on the given data. The odds…
Q: Performance Task Title: SAMPLING AND SAMPLING DISTRIBUTIONS GOAL: To gauge the performance of the…
A: The mathematical function =RANDBETWEEN( lower limit, upper limit) generates a random number between…
Q: Which of the following is NOT a conclusion of the Central Limit Theorem? Choose the correct answer…
A: The central limit theorem applies to the sampling distribution of x^ and not to the distribution of…
Q: The International Air Transport Association surveys business travelers to develop quality ratings…
A: The 95% confidence interval estimate of the population mean rating for Miami is:(5.73,…
Q: Does money buy happiness? This is an age-old question. A random sample of 1993 subjects were asked…
A: The objective of the question is to analyze the relationship between income and happiness. This is a…
Q: Bonferroni (I) VAR00002 (J) VAR00002 Mean Difference (I-J) Std. Error Sig. 95%…
A: The objective of the question is to identify the most significant pair-wise comparison prior to any…
Q: You are conducting a study of three types of feed supplements for cattle to test their effectiveness…
A: The objective of this question is to calculate the between-group sum of squares (SS_between) in a…
Q: Performance Task Title: SAMPLING AND SAMPLING DISTRIBUTIONS GOAL: To gauge the performance of the…
A: The objective of this question is to create a normal curve for each subject (Filipino, English,…
Q: Fifty cities provided information on vacancy rates (in %) for local apartments in the following…
A: Given frequency distribution table is,Vacancy Rate (in percent)Frequency 55102010
Q: 1. [25 pts] Here is a plate model. A Obiect1 B E F Object2 a. What probability distributions do we…
A: The objective of the question is to identify the probability distributions required for a given…
Q: In the country of United States of Heightlandia, the height measurements of ten-year-old children…
A: The heights (in inches) of 10-year-old children have a normal distribution.Mean, Standard deviation,…
Q: Find the probability of throwing a sum of 2 at least 4 times in 7 throws of a pair of fair dice.…
A: For a pair of fair dice thrown, the results are obtained as follows:In this case, each of the throws…
Q: 1. Predicting expected revenue in dollars from a new customer, predicting sales revenue for a store,…
A: When it comes to making predictions, various scenarios arise across different domains. Consider the…
Q: 4. If 1 8! + 1 X find x. 9! 10!
A:
Q: Suppose X is a discrete random variable which only takes on positive integer values. For the…
A: It is required to find the value of the probability , for the given random variable X.


Trending now
This is a popular solution!

Step by step
Solved in 5 steps with 3 images

- The following estimated regression equation based on 30 observations was presented. ŷ = 17.6 + 3.8x1 − 2.3x2 + 7.6x3 + 2.7x4 The values of SST and SSR are 1,808 and 1,780, respectively. (a) Compute R2. (b) Compute Ra2. (c) Comment on the goodness of fit.The following estimated regression equation is based on 30 observations. y=17.4 - 4.0x 1- 2.3x2 +7.3x32.9x4 The values of SST and SSR are 1,808 and 1,760, respectively. Compute R2 (to 3 decimals). Compute Ra2 (to 3 decimals). How good is the fit provided by the estimated regression equation?which of the following regressions represents the strongest negative linear relationship between x and y? (Attached in picture provided)
- The following table displays the mathematics test scores for a random sample of college students, along with their final SY16C grades. a. Fit the regression line y = a+bx to the data and interpret the results. b. Use the regression equation to determine the SY16C grade for a college student who scored60 on their achievement test. What would their SY16C grade be?Using this regression equation, Ŷ = .45X+ 9, find the SSresidual you would need to calculate the standard error of the estimate. X Y 15 3 12 6 17 2 11 5Run a regression analysis on the following data set, where yyis the final grade in a math class and xxis the average number of hours the student spent working on math each week. hours/weekxGradey445.6548661.4107710771284.81376.21699.41910020100 State the regression equation y=m⋅x+by=m⋅x+b, with constants accurate to two decimal places. What is the predicted value for the final grade when a student spends an average of 15 hours each week on math? Grade = Round to 1 decimal place.
- The following table shows the annual expenditures, in dollars, per customer unit for residential landline phone services and cellular phone services in the United States in the given year.† Year Landline Cell 2004 592 378 2006 542 524 2008 467 643 2010 401 760 Calculate the regression line for each type of service. (Let t be the time in years since 2004, L be the operating revenue of landline phone services and C be the expenditure of cellular services. Round your regression parameters to two decimal places.) L(t) = C(t) = Determine the expenditure level at which the two lines cross. Round your answer for the expenditure level to one decimal place. million dollarsRun a regression analysis on the following data set, where yy is the final grade in a math class and xx is the average number of hours the student spent working on math each week. hours/weekx Gradey 5 59 6 54.4 6 56.4 8 59.2 11 68.4 12 78.8 13 75.2 14 89.6 14 89.6 16 87.4 State the regression equation y=m⋅x+by=m⋅x+b, with constants accurate to two decimal places. What is the predicted value for the final grade when a student spends an average of 15 hours each week on math?Grade = Round to 1 decimal place.Consider the set of ordered pairs shown below. Assuming that the regression equation is y= 2.814 + 0.406x and the SSE = 5.313, construct a 90% prediction interval for x= 3. x 6 0 4 4 4 2 y 5 3 6 5 3 3 Calculate the upper and lower limits of the prediction interval. UPL=LPL= Someone please help me solve this! Thank you!
- Use the sample data given in tablex 1 2 3 4 5y 3 4 1 2 1a) To Write the regression equation ̂y=mx+bb) Plot the regression equation and the scatter diagram on the same graphUse the following table to find the equation of the regression line, between x and y x312304y210342The accompanying data resulted from an experiment in which weld diameter and shear strength (in pounds) were determined for five different spot welds on steel. Below are the data collected and the regression equation. Diameter Strength 200.1 813.7 210.1 785.3 220.1 960.4 230.1 1118.0 240.0 1076.2 Strength = -941.6992 + 8.5988*Diameter The predicted y-hat value for a diameter of 201 is 864. if we observed a weld that had a diameter of 235 that had a strength 1000, what would be its residual?