The following estimated regression equation relating sales to inventory investment and advertising expenditures was given. ý = 21 + 13x₁ + 9x₂ The data used to develop the model came from a survey of 10 stores; for those data, SST = 16,000 and SSR = 11,680. (a) For the estimated regression equation given, compute R R². R² 2 (b) Compute R (Round your answer to two decimal places.) a 2
The following estimated regression equation relating sales to inventory investment and advertising expenditures was given. ý = 21 + 13x₁ + 9x₂ The data used to develop the model came from a survey of 10 stores; for those data, SST = 16,000 and SSR = 11,680. (a) For the estimated regression equation given, compute R R². R² 2 (b) Compute R (Round your answer to two decimal places.) a 2

Functions and Change: A Modeling Approach to College Algebra (MindTap Course List)
6th Edition
ISBN:9781337111348
Author:Bruce Crauder, Benny Evans, Alan Noell
Publisher:Bruce Crauder, Benny Evans, Alan Noell
Chapter5: A Survey Of Other Common Functions
Section5.6: Higher-degree Polynomials And Rational Functions
Problem 1TU: The following fictitious table shows kryptonite price, in dollar per gram, t years after 2006. t=...

Related questions
Question
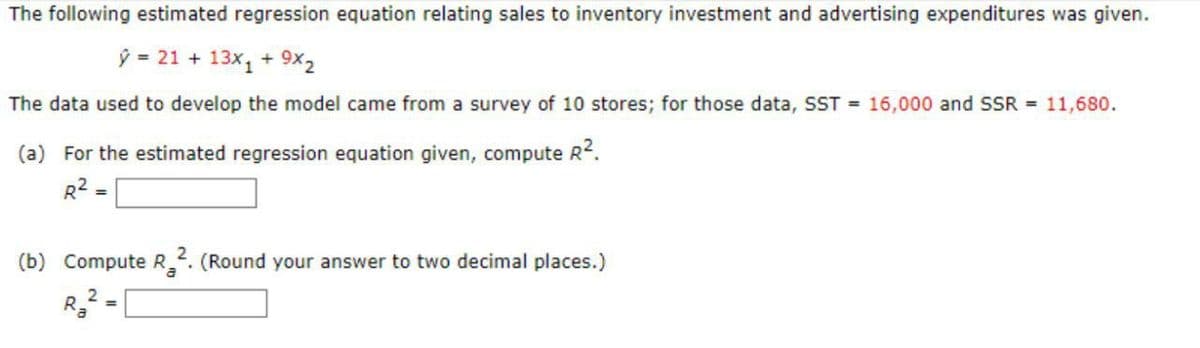
Transcribed Image Text:The following estimated regression equation relating sales to inventory investment and advertising expenditures was given.
ý = 21 + 13x₁ + 9x₂
The data used to develop the model came from a survey of 10 stores; for those data, SST = 16,000 and SSR = 11,680.
(a) For the estimated regression equation given, compute R².
R² =
(b) Compute R2. (Round your answer to two decimal places.)
2
R₂
Expert Solution
This question has been solved!
Explore an expertly crafted, step-by-step solution for a thorough understanding of key concepts.

Step by step
Solved in 2 steps with 2 images

Recommended textbooks for you
Functions and Change: A Modeling Approach to Coll…
Algebra
ISBN:
9781337111348
Author:
Bruce Crauder, Benny Evans, Alan Noell
Publisher:
Cengage Learning

Functions and Change: A Modeling Approach to Coll…
Algebra
ISBN:
9781337111348
Author:
Bruce Crauder, Benny Evans, Alan Noell
Publisher:
Cengage Learning