The following graph plots the supply and demand curves in the market for motor scooters. Use the black point (plus symbol) to indicate the equilibrium price and quantity of motor scooters. Then use the green point (triangle symbol) to fill the area representing consumer surplus, and use the purple point (diamond symbol) to fill the area representing producer surplus. ? PRICE (Dollars per scooter) 250 225 200 150 125 100 75 8 25 Demand 0 Supply 30 60 90 120 150 180 210 240 270 300 QUANTITY (Millions of scooters) Equilibrium A Consumer Surplus Producer Surplus
The following graph plots the supply and demand curves in the market for motor scooters. Use the black point (plus symbol) to indicate the equilibrium price and quantity of motor scooters. Then use the green point (triangle symbol) to fill the area representing consumer surplus, and use the purple point (diamond symbol) to fill the area representing producer surplus. ? PRICE (Dollars per scooter) 250 225 200 150 125 100 75 8 25 Demand 0 Supply 30 60 90 120 150 180 210 240 270 300 QUANTITY (Millions of scooters) Equilibrium A Consumer Surplus Producer Surplus

Chapter4: Markets In Action
Section: Chapter Questions
Problem 1SQP

Related questions
Question
Total surplus in the market $...........
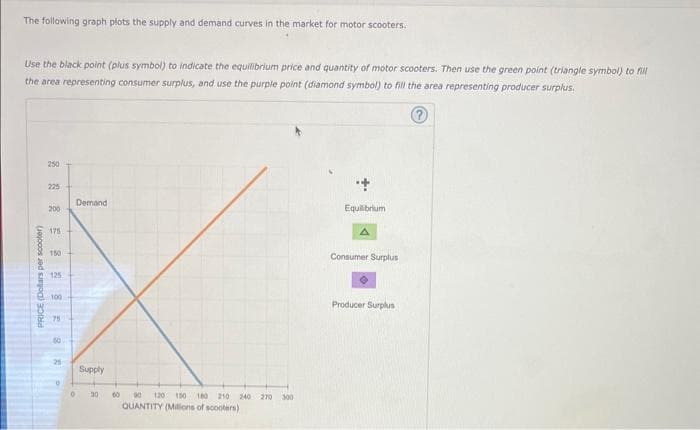
Transcribed Image Text:The following graph plots the supply and demand curves in the market for motor scooters.
Use the black point (plus symbol) to indicate the equilibrium price and quantity of motor scooters. Then use the green point (triangle symbol) to fill
the area representing consumer surplus, and use the purple point (diamond symbol) to fill the area representing producer surplus.
?
PRICE (Dollars per scooter)
250
225
200
150
125.
100
75
25
Demand
0
Supply
30
60 90 120 150 180 210 240 270 300
QUANTITY (Millions of scooters)
Equilibrium
A
Consumer Surplus
Producer Surplus

Transcribed Image Text:Total surplus in this market is $
million.
Expert Solution
This question has been solved!
Explore an expertly crafted, step-by-step solution for a thorough understanding of key concepts.

This is a popular solution!

Trending now
This is a popular solution!

Step by step
Solved in 3 steps with 1 images

Knowledge Booster


Learn more about
Need a deep-dive on the concept behind this application? Look no further. Learn more about this topic, economics and related others by exploring similar questions and additional content below.Recommended textbooks for you


Economics (MindTap Course List)
Economics
ISBN:
9781337617383
Author:
Roger A. Arnold
Publisher:
Cengage Learning