The following graph shows a hypothetical economy in long-run equilibrium at an expected price level of 120 and a natural output level of $600 billion. Suppose households suddenly begin to spend less and save more in order to increase saving for retirement. Using the graph, shift the short-run aggregate supply (AS) curve or the aggregate demand (AD) curve to show the short-run impact of the sharp increase in saving. PRICE LEVEL 240 200 160 120 80 8 0 200 400 600 800 OUTPUT (Billions of dollars) AS AD 1000 1200 ģ 4 AS ? the price level In the short run, the decrease in consumption spending associated with the increase in saving causes the price level to people expected and the quantity of output to the natural level of output. The sharp increase in saving will cause the unemployment rate to the natural rate of unemployment in the short run. Again, the following graph shows a hypothetical economy experiencing long-run equilibrium at the expected price level of 120 and natural output level of $600 billion, prior to the decrease in consumption spending associated with the increase in saving. Along the transition from the short run to the long run, price-level expectations will curve will shift to the. and the
The following graph shows a hypothetical economy in long-run equilibrium at an expected price level of 120 and a natural output level of $600 billion. Suppose households suddenly begin to spend less and save more in order to increase saving for retirement. Using the graph, shift the short-run aggregate supply (AS) curve or the aggregate demand (AD) curve to show the short-run impact of the sharp increase in saving. PRICE LEVEL 240 200 160 120 80 8 0 200 400 600 800 OUTPUT (Billions of dollars) AS AD 1000 1200 ģ 4 AS ? the price level In the short run, the decrease in consumption spending associated with the increase in saving causes the price level to people expected and the quantity of output to the natural level of output. The sharp increase in saving will cause the unemployment rate to the natural rate of unemployment in the short run. Again, the following graph shows a hypothetical economy experiencing long-run equilibrium at the expected price level of 120 and natural output level of $600 billion, prior to the decrease in consumption spending associated with the increase in saving. Along the transition from the short run to the long run, price-level expectations will curve will shift to the. and the

Chapter16: Macro Policy Debate: Active Or Passive?
Section: Chapter Questions
Problem 2.3P

Related questions
Question
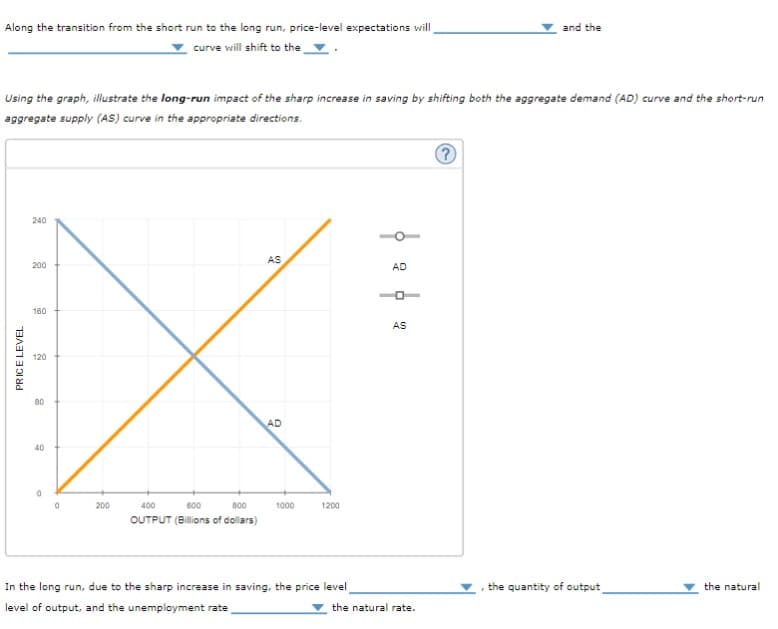
Transcribed Image Text:Along the transition from the short run to the long run, price-level expectations will
curve will shift to the
Using the graph, illustrate the long-run impact of the sharp increase in saving by shifting both the aggregate demand (AD) curve and the short-run
aggregate supply (AS) curve in the appropriate directions.
PRICE LEVEL
240
200
160
120
80
40
0
200
400
600
800
OUTPUT (Billions of dollars)
AS
AD
1000
1200
In the long run, due to the sharp increase in saving, the price level
level of output, and the unemployment rate
AD
AS
the natural rate.
and the
?
the quantity of output
the natural
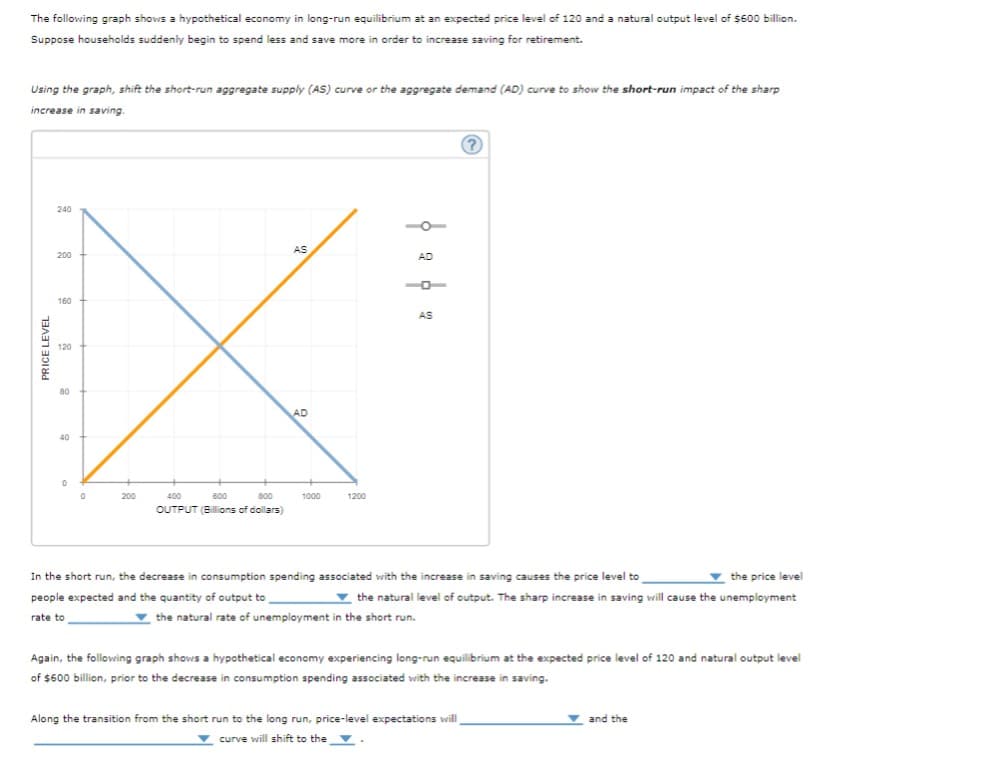
Transcribed Image Text:The following graph shows a hypothetical economy in long-run equilibrium at an expected price level of 120 and a natural output level of $600 billion.
Suppose households suddenly begin to spend less and save more in order to increase saving for retirement.
Using the graph, shift the short-run aggregate supply (AS) curve or the aggregate demand (AD) curve to show the short-run impact of the sharp
increase in saving.
PRICE LEVEL
240
200
160
120
80
40
0
0
200
400
600
800
OUTPUT (Billions of dollars)
AS
AD
1000
1200
фефе
?
the price level
In the short run, the decrease in consumption spending associated with the increase in saving causes the price level to
people expected and the quantity of output to
the natural level of output. The sharp increase in saving will cause the unemployment
rate to
the natural rate of unemployment in the short run.
Again, the following graph shows a hypothetical economy experiencing long-run equilibrium at the expected price level of 120 and natural output level
of $600 billion, prior to the decrease in consumption spending associated with the increase in saving.
Along the transition from the short run to the long run, price-level expectations will
▼curve will shift to the.
and the
Expert Solution
This question has been solved!
Explore an expertly crafted, step-by-step solution for a thorough understanding of key concepts.

This is a popular solution!

Trending now
This is a popular solution!

Step by step
Solved in 5 steps with 3 images

Knowledge Booster


Learn more about
Need a deep-dive on the concept behind this application? Look no further. Learn more about this topic, economics and related others by exploring similar questions and additional content below.Recommended textbooks for you

Economics (MindTap Course List)
Economics
ISBN:
9781337617383
Author:
Roger A. Arnold
Publisher:
Cengage Learning

Economics (MindTap Course List)
Economics
ISBN:
9781337617383
Author:
Roger A. Arnold
Publisher:
Cengage Learning


